Operational Efficiency Analysis for Social Ops
"Operational efficiency analysis for social ops: metrics, baselines, and a review that separates real SLA gains from faster noise."
Monday morning, and the queue holds four unrelated problems wearing the same uniform. A refund demand sits in an Instagram reply under a nine-day-old post. Outage mentions on X are climbing by the minute. Two WhatsApp DMs and a Telegram message are impersonating your brand and asking customers for card details. A sarcastic quote-tweet about the new pricing page has more reach than your launch post, and it's still parked with support because nobody tagged it as comms.
An agent clears all four before lunch. The queue reads zero. Nothing in that number tells you whether the morning went well, and that's the problem this whole discipline solves.
Operational efficiency analysis for social and community operations isn't a productivity scoreboard for individuals. It's the practice of asking what an hour of reviewer time bought, who ended up owning the case, and whether the answer stayed true seven days later.
Table of Contents
- The Social Ops Efficiency Scorecard
- How to Run the Analysis in Five Moves
- Fast Queues That Are Still Inefficient
- Split Results by Language Channel and Risk
- A Weekly Review That Stops Reviewer Fatigue
- What to Change After the Baseline
The Social Ops Efficiency Scorecard
For a social care team, operational efficiency means quality-adjusted output per staff hour. Count the issues correctly closed, plus the ones correctly handed to finance, engineering, trust and safety, or communications. Divide by reviewer hours and fully loaded cost, which includes tooling, model inference, and the governance time that audits, permission checks, and tag correction consume.
Holding refunds, account decisions, and public statements with a human belongs inside that definition, not outside it as a brake. An auto-closed refund thread that resurfaces as a chargeback three days later is negative output, and it lands on someone else's sheet.
The clock comes first because social complaints are public and time-bound. Emplifi's guidance on social care SLA management puts average industry response time at 15.5 hours, against roughly two hours for mature brands running structured routing and monitoring. The same source reports that 58% of consumers consider it important to see brands respond to customers on social media, that about one-third expect a direct-message reply within one hour, and that only 8% will wait 48 hours before abandoning the interaction. That gap between 15.5 and two hours is a triage design problem, not a headcount problem.
Every metric maps to one failure
First-response time and SLA-breach rate catch the visible miss, but only if you track them per channel. A blended average will look healthy while Instagram DMs rot. Auto-closure rate earns a place on the sheet only for intents the team approved in writing, because closure is a claim about quality, not a count of sends.
Cost per resolved issue is the row that changes arguments with finance, since it prices reviewer minutes, routing overhead, and model inference against true resolutions. Escalation latency measures minutes from detection to the right owner. Noise-filtered share tells you how much inbound volume never needed a human, and repeat contact within seven days is the honesty check on all of it.
| Metric | What it counts | Working benchmark | Trap if used alone |
|---|---|---|---|
| First-response time | Clock from inbound to first useful reply on public posts and DMs | Industry average 15.5 hours; mature routed teams about 2 hours | A fast wrong reply still breaches trust |
| DM reply window | Share of private messages answered inside the customer clock | About one-third expect a reply within 1 hour; only 8% wait 48 hours | Chronological handling buries billing and outage DMs |
| Public response visibility | Whether customers see the brand answer on social | 58% say seeing a response matters | Vanity replies to noise inflate the rate |
| SLA-breach rate | Cases missing the channel clock | Track by channel, never as one global average | A blended average hides Instagram and Discord misses |
| Auto-closure rate | Repetitive low-risk intents closed without a human send | Report only on intents the team pre-approved | High closure with rising repeats is rework |
| Cost per resolved issue | Reviewer time plus routing and tooling cost per true resolution | Compare against the four-week baseline, not raw volume | Time saved upstream reappears in engineering or finance |
| Escalation latency | Minutes from detection to the right owner | Urgent billing, outage, and PR-risk cases same shift | Speed to the wrong queue isn't a save |
| Noise-filtered share | Inbound volume removed as spam, off-topic, or non-actionable | Expect a large majority of mentions to be non-actionable | Over-filtering drops slang, memes, and real harm |
| Repeat contact in 7 days | Same customer or issue returning after closure | Falling repeats with stable or better CSAT | Auto-close can hide the repeat in another channel |
Reading rule: a number that improves while the wrong owner still holds the case is activity, not efficiency.
Fill this sheet for four weeks before you touch a single routing rule. Split every row by channel, because X replies, TikTok comments, Discord threads, and Telegram DMs fail in different ways and average into a lie when combined.
How to Run the Analysis in Five Moves
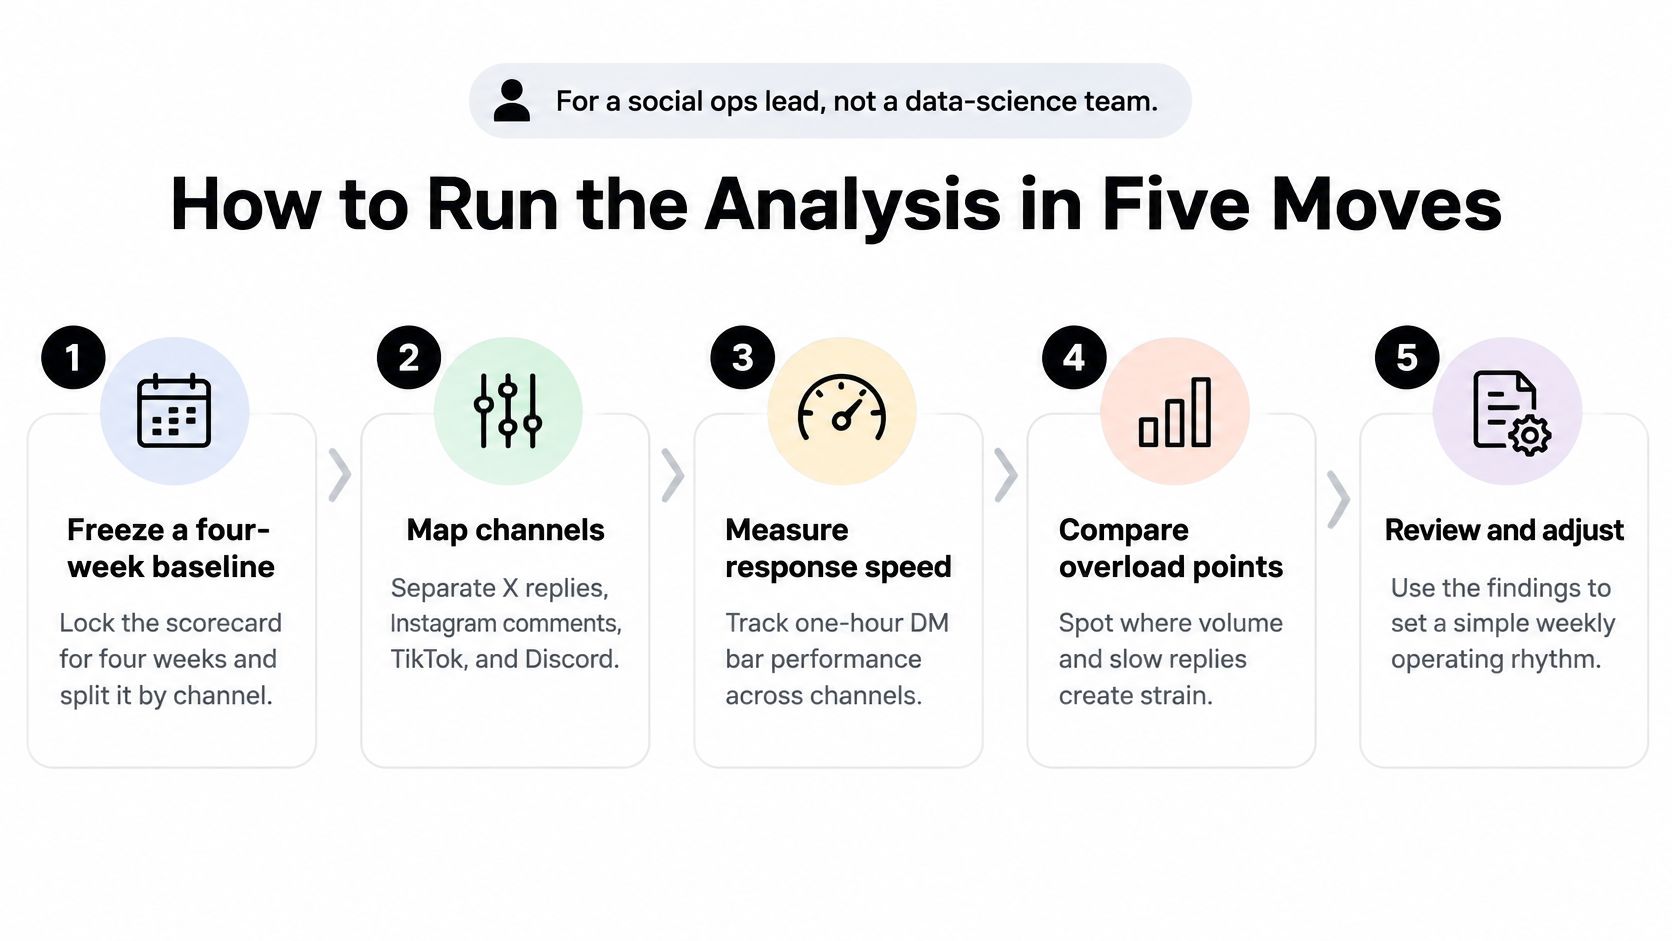
You don't need a data science team for this. You need four weeks of clean counts, one afternoon of intent mapping, and the discipline to write a decision down before anyone opens a dashboard. A social ops lead can run the whole thing from the export tab of the inbox and one spreadsheet.
The order matters more than the tool
Freeze a four-week baseline, split by channel. Keep X replies, Instagram comments, TikTok, Discord, Telegram, WhatsApp, and forum posts in separate columns from day one. Freeze it before anyone changes a keyword rule, so the before picture stays honest when a rollout slips three weeks. The slip here is starting the baseline after the first change, which turns the whole exercise into a defense of whatever you already shipped.
Map one week of volume by intent. Tag every inbound item as billing, outage, feature request, spam or scam, PR risk, or other, then write down which team touched it. Many teams find that a fifth of "support" volume is feature requests that belong with product, handled by the same two seniors who take the hard billing cases, which is a routing finding disguised as a capacity finding.
Compare output with input, the way productivity work always has. The OECD's measuring productivity manual defines productivity as the relationship between output volume and input volume, and traces how the field moved past counting output when Walter A. Shewhart developed the statistical control chart at Bell Telephone Laboratories in 1924, pushing teams to track variation, defects, and rework alongside volume. Count cases correctly resolved or correctly escalated per reviewer hour, and put cycle time, escalation rate, and first-contact resolution beside it. Messages touched is not output. The same normalization logic shows up at national scale, where the OECD's productivity database reports average labour productivity across OECD economies rising from about USD 43 per hour in 2000 to about USD 60 in 2023 in constant prices, and measures it as value added per hour worked rather than as total value added.
Hold out a control slice. Keep one region or one channel on the old keyword rules for the first month of any routing or draft-assist change, then compare cost per resolved issue, rework, and SLA breach against it. Without a holdout you're comparing this month to your memory of last month.
Write the decision in one sentence. Keep, narrow, or roll back the change, and name the human owner for refunds, account actions, and public statements. A decision that names no owner gets re-litigated at the next meeting.
The artifact is one page. Baseline column, after column, and the decision sentence at the bottom, readable in ninety seconds at a staff meeting.
Fast Queues That Are Still Inefficient
The most common false win looks like this. Auto-closure climbs for six weeks, the dashboard goes green, and repeat contacts climb behind it. The draft resolved the easy wording and missed the billing exception, so the customer comes back through email and the second contact never gets counted against the first.
The gap between perceived and realized gains is well documented in enterprise AI. OpenAI's State of Enterprise AI 2025 report records that workers save 40 to 60 minutes per active day with AI and that 75% say it improves speed or output quality, while separate enterprise research cited in the same analysis finds that only about half of AI initiatives deliver expected efficiency gains and about one in four meets expected growth impact.
That gap has an organizational cause. Gartner's survey of 265 service and support leaders found 77% reported pressure from senior executives to deploy AI, and 75% reported increased AI budgets. Pressure and budget both push toward a green dashboard, and the analysis is the only thing standing between you and one.
Four green numbers that lie
| What the dashboard shows | What is actually happening | Check before you celebrate |
|---|---|---|
| Auto-closure up | Repetitive intents close, exceptions bounce back as new tickets | Repeat contact within 7 days, by intent |
| Handle time down | Drafts are quick but the wrong team still owns the case | Escalation latency to finance, engineering, comms |
| Public SLA green | DMs and community threads wait past the one-hour expectation | SLA breach by channel, especially WhatsApp, Instagram, Discord |
| Messages per hour up during a scam spike | Duplicate fraud reports inflate throughput | Likely-fraud share and time to trust and safety |
| Noise filter above 80% | Slang, memes, and sarcasm dropped as irrelevant | A weekly human sample of filtered items |
| Reviewer hours flat | Seniors rewrite routine drafts instead of taking hard cases | Share of sends edited heavily, by intent |
| Queue volume down | Work moved into engineering or finance side channels | Downstream touches per escalated case |
Scam traffic is the cleanest example of volume theater. The Federal Trade Commission's social media scam data reports that one in four people who reported losing money to fraud since 2021 said the fraud began on social media, with reported social-media scam losses reaching $2.7 billion, more than any other contact method. A week of impersonation DMs can lift your messages-per-hour while every duplicate report pushes a real payment case further down the queue.
Reviewer fatigue is the hidden input on every row. If senior agents spend the afternoon rewriting brand voice on routine replies, the hour your filter saved never reached a customer.
Label every green number in your dashboard as real, inflated, or shifted. The label is the analysis.
Split Results by Language Channel and Risk
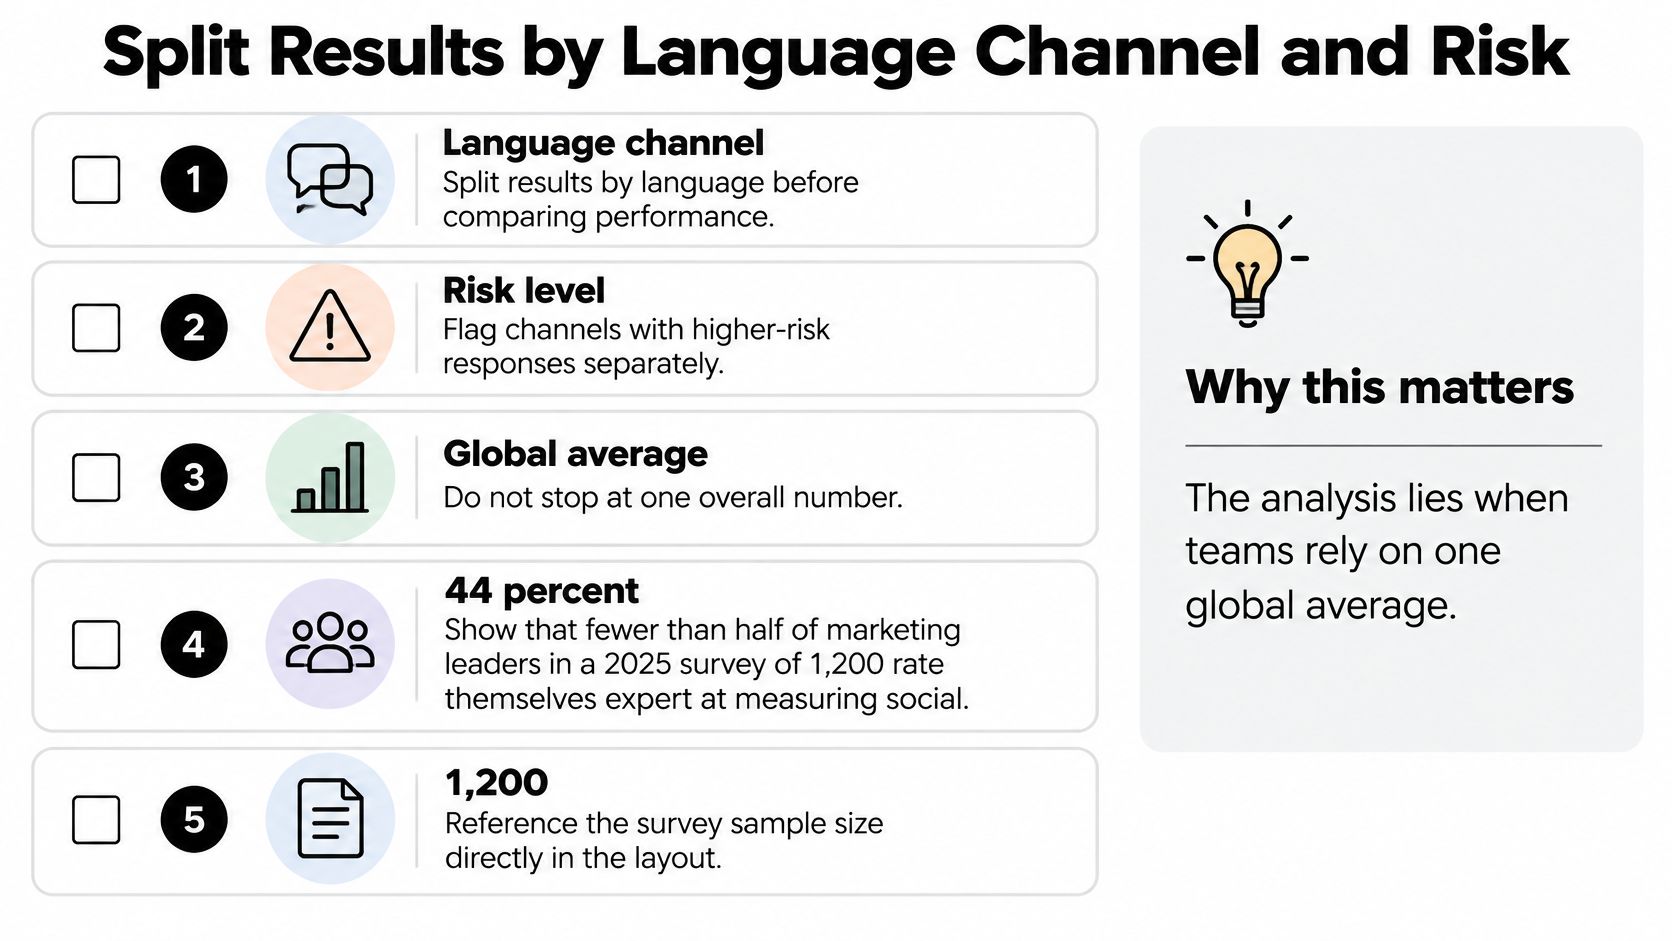
One global average is where a good analysis goes to die. A 90% precision figure that comes from English-language billing questions tells you nothing about Spanish sarcasm, Portuguese slang in a Discord server, or a screenshot of a failed payment posted as a meme.
You can't borrow a mature measurement culture from brand, either. A 2025 Sprout Social survey of 1,200 marketing leaders found that 44%, fewer than half, rated their teams as expert at measuring social-media business impact. Social ops has to build its own cuts.
What the cuts look like
Report precision and recall by language for at least the three languages carrying the most volume, plus a catch-all bucket for slang and code-switching. Do the same by issue type, because a refund dispute and a feature request fail in different directions. Add a separate cut for image and meme threads: a billing screenshot inside a Discord thread is not the same work as a text reply, and misreading it routes a paying customer into spam.
Channel is its own cut. WhatsApp, Instagram DMs, Telegram, and Discord each carry a different clock and a different risk profile, and a single blended breach rate hides all four.
| Cut | Metrics to report | Red flag |
|---|---|---|
| Language (top three, plus a slang catch-all) | Precision, false escalation, human-review rate | The gain concentrates in one language |
| Channel (X, Instagram, TikTok, Discord, Telegram, WhatsApp, forums) | SLA breach on the customer clock, repeat contacts | A blended average hides one channel's misses |
| Issue type (billing, outage, scam, PR risk, feature request) | Escalation latency, downstream touches | Easy intents carry the whole gain |
| Image or meme threads | Misread rate on screenshots, human-review rate | Billing screenshots routed as spam |
| Crisis window | Time to detect, time to first approved statement | The first public statement lands after the day is out |
Where the human stays
Refunds, account takeover, and public accusations keep a 100% human-review rate even when that drags the average up. An avoided regulatory complaint and a scam warning issued before the payment went through are operational outcomes, and any model that leaves them off the sheet is measuring the wrong thing.
Governance belongs in the cost line too. Auditing, permission checks, monitoring, and correcting bad tags consume real hours every week, and teams that exclude them from cost per resolved issue end up surprised when the finance review catches up.
An apparently slower workflow with deliberate human review is often the cheaper one over a full lifecycle, because it doesn't pay for the failure later.
A Weekly Review That Stops Reviewer Fatigue
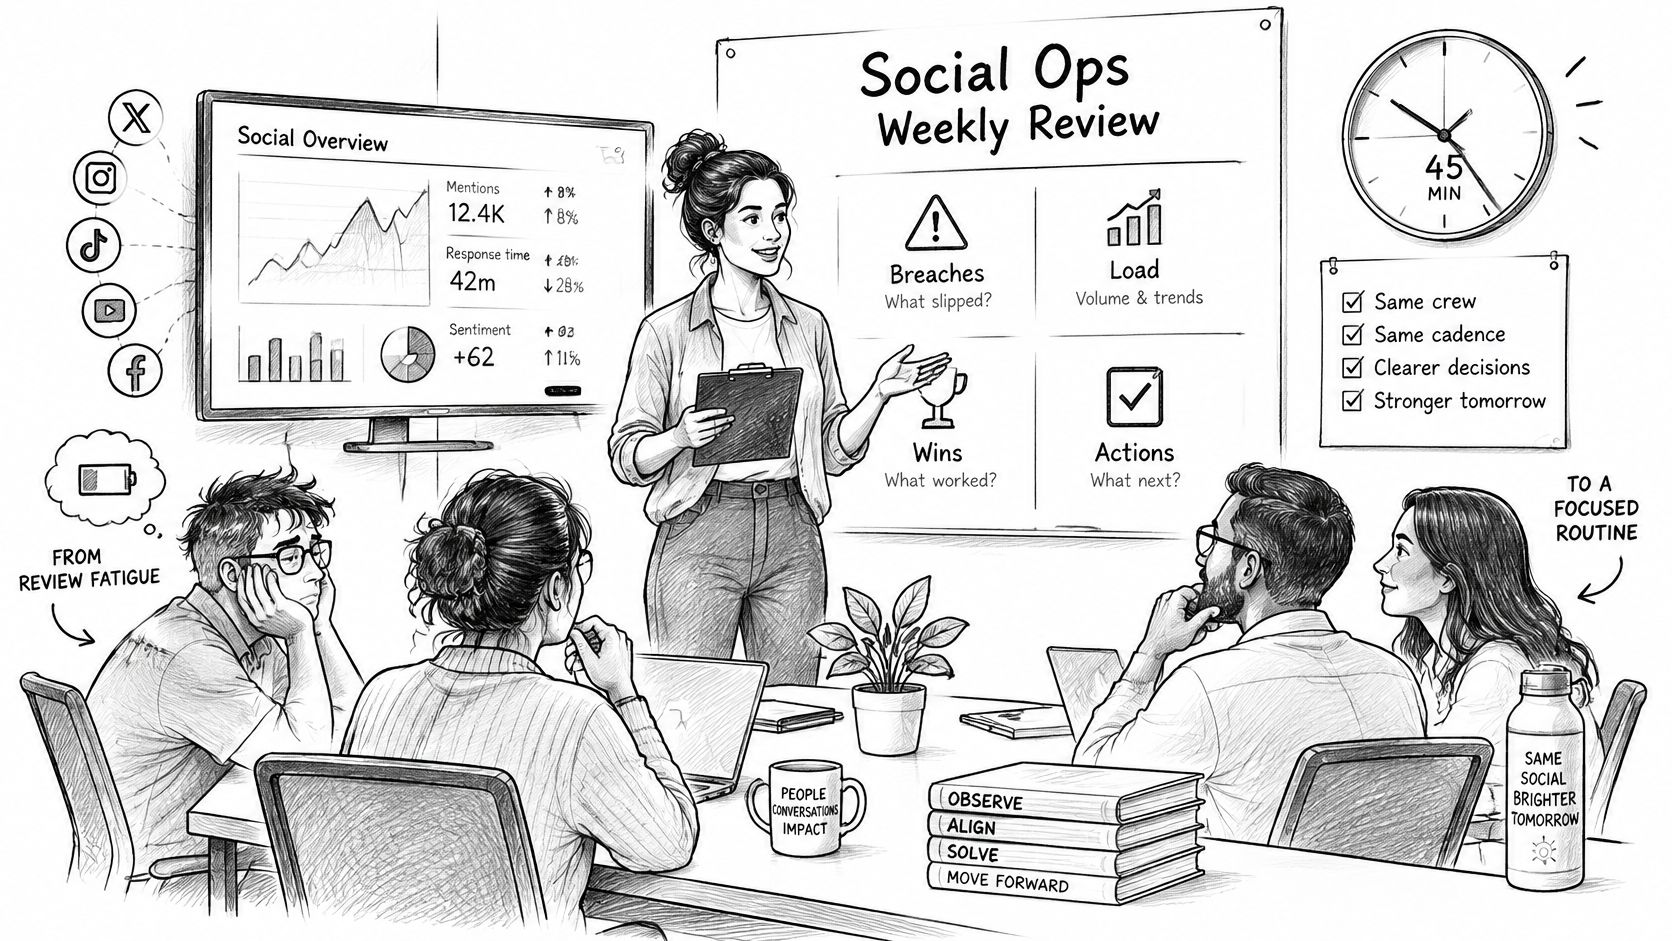
A dashboard can show faster replies while repeat contacts climb, rework shifts to senior staff, and risky threads sit without an owner. Put a 45-minute review on the calendar, owned by social ops rather than whoever last edited the reporting setup, and run the same four beats every week. Speed matters only when the outcome stayed correctly owned.
Breaches first. Name the channel that missed the one-hour DM bar or the public clock, then identify the intent behind the miss. “Instagram was slow” leaves the team nowhere to act. “Billing DMs in Spanish breached the hour on Tuesday and Thursday” points to staffing, routing, or coverage.
Then routing misses. Look for billing requests in the community queue, outage signals sitting with support, and PR risk with neither a reply nor an accountable owner. Direct messaging deserves particular attention because scam attempts often reach people through channels built around private messages. Treating DMs as lower-priority public mentions can leave the riskiest conversations invisible.
Third, human load. Check who is rewriting drafts, who is working through duplicate scam reports, and whether senior reviewers are spending the afternoon on noise. Rising automation can still increase cost when it pushes difficult cases downstream. If the same two agents appear here three weeks running, change the routing rather than blaming their speed.
Last, choose one change for next week. Keep it small enough to remeasure, such as adding a tag for payment-request language or setting a same-shift ownership rule for mention spikes. Give it one owner and one metric to compare against the baseline.
Keep the meeting honest
- Sample 25 filtered items by hand each week. A noise model that hides one real complaint can cost more than the review hour saves.
- Cap auto-send to intents approved in writing. Verbal approval at a standup will not hold up during an audit or a bad week.
- Pair every automation number with repeats and escalation latency. Auto-closure alone cannot show whether the work reached the right owner.
- Write targets as ranges against the baseline. A single heroic number invites gaming and, later, a quiet rollback.
- Quote the decision in the notes. Next week should begin with an agreed commitment instead of reopening the same debate.
When reviewer fatigue is the binding constraint, reducing the queues in front of each person usually helps more than adding a faster reply macro. Skip the tour through every chart and spend the meeting on the two rows that moved.
What to Change After the Baseline
A baseline earns its keep only if it forces a decision. Three calls cover almost every result, and each one has a clear evidence test.
Keep and widen when cost per resolved issue and seven-day repeats both improved, and every refund, account decision, and public statement still had a human on the send. Extend automation one intent at a time rather than one channel at a time. Widening by intent keeps the comparison clean: if billing-question drafts cut resolution cost next month, you know which change did it. Widening by channel mixes five variables at once and leaves you arguing about attribution in the next review.
Narrow when speed improved but escalation latency or repeats worsened. Pull automation back to noise filtering and drafts, put people back on refunds, account actions, and anything public during a spike, and re-run the measurement before you defend the original rollout. A queue that closes fast and reopens on day six looks efficient on the handle-time chart and expensive everywhere else.
Localize when the gain lives in one language or one channel. A win concentrated in English X replies is not a mandate for a global auto-closure target, and rolling it up as one is how a good pilot turns into a bad program. Set the target where the evidence sits and treat the rest of the queue as still unmeasured.
The crisis control you keep running
Response speed dominates how people judge a brand in a reputational moment. An exploratory study of 210 users across four high-profile reputational cases, published in a crisis response analysis in Management Papers, found response speed the most highly rated effectiveness factor, accounting for 68% of indications with an average importance rating of 4.6. Within its response categories, 44% evaluated an immediate response, preferably within 24 hours, positively, 31% associated a two to three day delay with weak preparedness and declining trust, and 25% viewed silence most negatively.
That makes the crisis rule a standing control rather than a special project. Detect unusual mention velocity, cluster related posts, separate genuine customer harm from spam, send product and outage facts to engineering, and route the draft statement to communications for a facts check and approval before anything goes out. The teams that handle spikes well built this routing before they needed it, because configuring escalation paths mid-crisis means your fastest hour is spent on setup instead of response.
Report three numbers upward, not twelve: SLA breach on the customer clock, cost per resolved issue, and the share of urgent cases that reached the right owner inside the shift. A unified inbox with intent triage is what makes those cuts possible, and it is the work Sift AI's agents do: triage, route, research, and reply across social channels, with your team deciding what they handle and when a person steps in.
Sift AI gives social and community teams one command center for this measurement: a unified inbox across X, Instagram, WhatsApp, Telegram, Discord, Facebook, and forums, with agents that filter noise, tag intent, and route each case to finance, engineering, or comms. Your team chooses which cases the agents handle and when a person steps in, so approval sits where your risk policy puts it. The Team Time dashboard keeps time in status, live activity, and targets in one operational view, and the Brief agent sends leadership a proactive summary instead of a twelve-tab dashboard tour. Build the four-week scorecard from your inbox export, then let the baseline decide what gets automated and what stays human.