Operational Analysis Report: Core Sections and Metrics
"An operational analysis report explained: its core sections, the metrics that matter, and how to act on its findings to improve performance."
Your weekly dashboard shows faster replies and more closed cases, but customers are still chasing billing fixes in DMs. As the social ops lead, you need to explain that gap before the same numbers reach executives.
Table of Contents
- What an Operational Analysis Report Is and Why It Exists
- The Eight Sections Every Operational Analysis Report Needs
- Metrics to Include and How to Define Them
- Channel Windows Risk Signals and Separate SLAs
- Why Closed Tickets Can Hide Failing Work
- Turn Findings Into One Owned Decision
- A Billing Spike and an Outage Surge in One Week
What an Operational Analysis Report Is and Why It Exists
An operational analysis report is a fact-based diagnosis that connects observed work to a named performance change. It explains what happened, why it happened, and who should act.
A dashboard shows open volume, aging, and SLA clocks, like a speedometer and warning lights. The report is the mechanic's repair plan: it distinguishes a staffing shortage from a routing failure and recommends a correction.

The discipline began in British operational research in the late 1930s, when scientists measured real operations, applied statistics, and translated findings into military decisions, according to this history of operational research. By the end of World War II, the practice had spread across the Allies, with close to 1,000 people engaged in Britain.
For social operations, the scope includes inbound volume, response time, escalation rate, reviewer load, auto-closure, and verified outcomes across X, Instagram, TikTok, Discord, Telegram, WhatsApp, and owned forums. Include feature requests buried in DMs and multilingual complaints, not just easy-to-classify support tickets.
Give each reader a decision
Weekly readers need queue and routing decisions. Quarterly readers need target variance, risk, and customer impact.
A metric earns its place when you can explain what moved it and name who acts on it.
The standard: Evidence plus a repair plan, not a scoreboard.
The report's core sections give that evidence a repeatable structure.
The Eight Sections Every Operational Analysis Report Needs
| Section | Question it answers | What it contains | Main reader |
|---|---|---|---|
| Executive summary | What changed, and does it matter? | Headline KPIs against target, top three risks, decisions needed | Executives and directors |
| Scope and period | What was measured, and over what dates? | Channels, time zone, data sources, exclusions | Every reader |
| Volume and mix | How much work arrived, and what kind? | Inbound count by channel and intent, spam and scam share | Ops managers |
| Performance against targets | Are SLAs being met? | First response, resolution time, and SLA attainment by queue | Team leads |
| Process and routing | Where does work get stuck? | Routing accuracy, reassignments, escalation paths, handoff times | Ops and routing owners |
| Outcomes and quality | Did the work actually help the customer? | Verified resolution, repeat contact, sampled accuracy | Support and product leads |
| Risks and exceptions | What needs a human decision? | Crisis flags, fraud reports, policy breaches, low-confidence cases | Comms and trust and safety |
| Actions and owners | What happens next, and who owns it? | Corrective actions with owner, target date, and validation date | Everyone |
Organize the report around decision levels
Use an operational view for current queues and aging, a tactical view for process and routing, and an executive view for trends, risk, target variance, and business impact. This structure puts the corrective-action purpose of ITIL's measurement and reporting guidance into practice.
Operational evidence feeds Volume and Performance. Tactical evidence feeds Process and Routing; executive findings belong in the Executive Summary and Risks.
Each KPI should show its current value, historical baseline, target, relevant sample size, and named corrective action when performance deviates. A weekly working report can focus on scope, volume, performance, and actions, while the quarterly leadership version should retain all eight parts.
Break process performance into stages
NIST's incident-handling guide recommends recording total labor effort and elapsed time across incident onset, discovery, impact assessment, containment, recovery, management notification, and external reporting. That distinction matters: work can consume little handling time while waiting a long time for approval.
In a unified inbox, capture signal creation, detection, intent tagging, owner routing, acknowledgment, response, escalation, resolution, and verified closure. A long discovery interval warrants checking monitoring coverage; a long containment interval warrants checking ownership, access, and decision delays.
For an outage, that sequence might run from a Discord signal to engineering ownership, a comms-approved holding statement, and an external update. Don't assume the responder caused the delay because they posted last.
Treat the table as a skeleton. Fill each row with actual evidence before adding charts.
Metrics to Include and How to Define Them
| Metric | Layer | What it reveals | Pair it with |
|---|---|---|---|
| Backlog age | Operational | Work waiting longest in each queue | Queue volume |
| Detection-to-routing latency | Operational | Time from signal to the right owner | Misroute rate |
| Workload per agent | Operational | Whether the team can absorb current volume | Backlog age |
| First response time | Tactical | Speed of the first human or AI reply | SLA attainment |
| Escalation rate by destination | Tactical | Share handed to finance, engineering, comms, or trust and safety | Escalation precision |
| Auto-closure rate | Tactical | Share closed without a human | Reopen rate and sampled accuracy |
| Median and P90 resolution time | Outcome | How long real fixes take, including the slow tail | Repeat-contact rate |
| Repeat-contact rate | Outcome | Customers returning on the same issue | Resolution time |
| Severity-weighted impact | Executive | Customer harm weighted by urgency | Raw volume |
| Exception rate and time to human review | Governance | Cases needing human decisions and how fast review happens | Audit trail completeness |
Read the layers differently
Operational measures tell you where to intervene today. Read backlog age alongside queue size: a small queue can still contain abandoned cases. For workload per agent, distinguish assigned work from actively handled work so absent staff don't appear to provide capacity.
Tactical measures reveal workflow quality. Split first response into automated acknowledgment and substantive response; otherwise an instant receipt message can make a stalled investigation look healthy. Break escalation rates out by destination so finance capacity isn't confused with engineering demand.
For outcomes, report the median and P90 together. The median describes the middle case; P90 describes the slower tail. A mean alone can obscure whether most customers improved while difficult cases continued to wait.
Set severity weights explicitly. Explain why an impersonation report receives greater urgency than a routine feature request rather than presenting the weighted total as an objective count.
Build a definition sheet
For every row, record:
- Clock: Business hours or elapsed time, with start and stop events.
- Time zone: The reporting zone and treatment of cross-region shifts.
- Pause rule: Whether waiting for customer information stops the clock.
- Denominator: Eligible cases, including exclusions and duplicate handling.
- Evidence: Source system, accountable owner, and available sample.
Use volume-normalized rates alongside raw counts. More escalations during a busy period don't necessarily mean routing deteriorated; the share of eligible cases and their severity help explain the change.
For repeat contact, specify what counts as the same issue and how cross-channel identity is established. Where you can't confidently connect a Telegram message to an earlier Instagram DM, disclose the gap instead of treating it as a new, unrelated customer.
Governance belongs in this definition sheet too. Track exception rate, time to human review, and the share of actions with traceable evidence. The Roland Berger analysis of customer-service AI identifies governance, data quality, legacy systems, and management alignment as barriers to scaling, making these operating concerns rather than appendix material.
Channel Windows Risk Signals and Separate SLAs
A public post left unanswered can push a customer toward a competitor. Track open mentions alongside response speed, because a fast average can conceal individual cases that have gone quiet.
| Control | Rule | What to measure |
|---|---|---|
| Public reply | More than 75% of customers expect a social-media response within 24 hours, according to a 2025 Sprout Social Index finding reported by Shopify | First response within that period by public channel |
| Silence risk | Unanswered public mentions can send customers looking elsewhere | Public mentions still open after 24 hours |
| WhatsApp window | A 24-hour customer-service window opens or resets whenever a user sends a message, under WhatsApp's business policy | Share answered inside the window |
| After expiry | Outbound messages require approved Message Templates | Template-dependent follow-ups |
| Human path | Automation inside the window requires prompt, clear, direct escalation to human support | Escalation availability |
| Auto-closure | Closure rules should preserve a path to help for customers who still need it | Closures with no human path |
| Scam contact | Consumers reported losing more than $3 billion to online-origin scams in 2024; $1.9 billion involved social-media contact, and 70% of people reporting social-platform contact said they lost money, according to the FTC | Time to route high-risk items to trust and safety |
| X coverage | The filtered stream permits one connection, up to 1,000 rules, and up to 250 posts per second, according to X's API documentation | Connection health and fallback |
Separate expectations from operating rules
A customer expectation is a planning signal, not a universal service-level agreement. A messaging window is a platform rule, not a promise that the issue will be resolved before it expires. Set distinct targets for public replies, private messages, and escalated cases. Report first response, unresolved aging, escalation time, and auto-closure by channel and intent.
Ownership should follow the work. Route billing disputes to finance. Send outage surges to engineering and communications, with separate owners for technical investigation and public updates.
Treat risk and coverage as controls
Scam waves need a different path from routine engagement. Preserve the original message and relevant context, route suspicious payment requests or impersonation reports to trust and safety, and measure how quickly reviewers separate them from ordinary support.
For X monitoring, test outage phrases and crisis terms against the active rule set. Report disconnected streams and fallback procedures. An empty queue may mean the stream lost coverage, not that the channel was quiet.
Why Closed Tickets Can Hide Failing Work
Auto-closure rate looks like success until you check whether the customer came back. Say an AI-drafted public reply explains where to find an invoice, the customer reacts with a thumbs-up, and the case closes. The customer then sends a DM because the charge itself is still wrong.
That's an apparent closure, not a durable resolution. Lower contact volume isn't automatically better either: a frustrated customer may leave the measured queue without receiving help.
Follow the resolution chain
Track initial signal → ownership → action → outcome → recurrence. Attach a confidence level to the outcome attribution, especially when identity matching across channels is incomplete.
For the invoice case, the public reply is evidence of an action. A corrected charge or customer confirmation is stronger evidence of an outcome. An absence of further messages is weaker evidence, not proof.
The evidence gap also affects financial claims: 68% of surveyed leaders said AI metrics were linked to measurable ROI, yet only 43% had enough data to determine whether AI was paying off, according to Dialpad's customer-service AI research.
Show data coverage beside every headline KPI. State which channels are connected, which cases have verified outcomes, and where customer identity remains uncertain.
A closed status is a workflow event. A resolved problem is an outcome that needs evidence.
Compare like work, not just handling methods
Compare automated and human-handled cases on repeat contact, customer effort, and escalation quality. Match intent and severity where possible; humans handling refund disputes shouldn't be judged against automation handling opening-hours questions.
Don't blend billing complaints on X with outage conversations on WhatsApp. Their dependencies and risks differ, so a channel-wide average can conceal an unresolved billing problem beneath fast outage acknowledgments.
Before a headline reaches executives, require these checks:
- Repeat contact: Did the customer return elsewhere about the same issue?
- Sampled accuracy: Did reviewed cases receive correct, policy-aligned help?
- Action ownership: Who will intervene if the result deteriorates?
These checks keep the report focused on customer outcomes rather than throughput alone.
Turn Findings Into One Owned Decision
Build the decision before the presentation
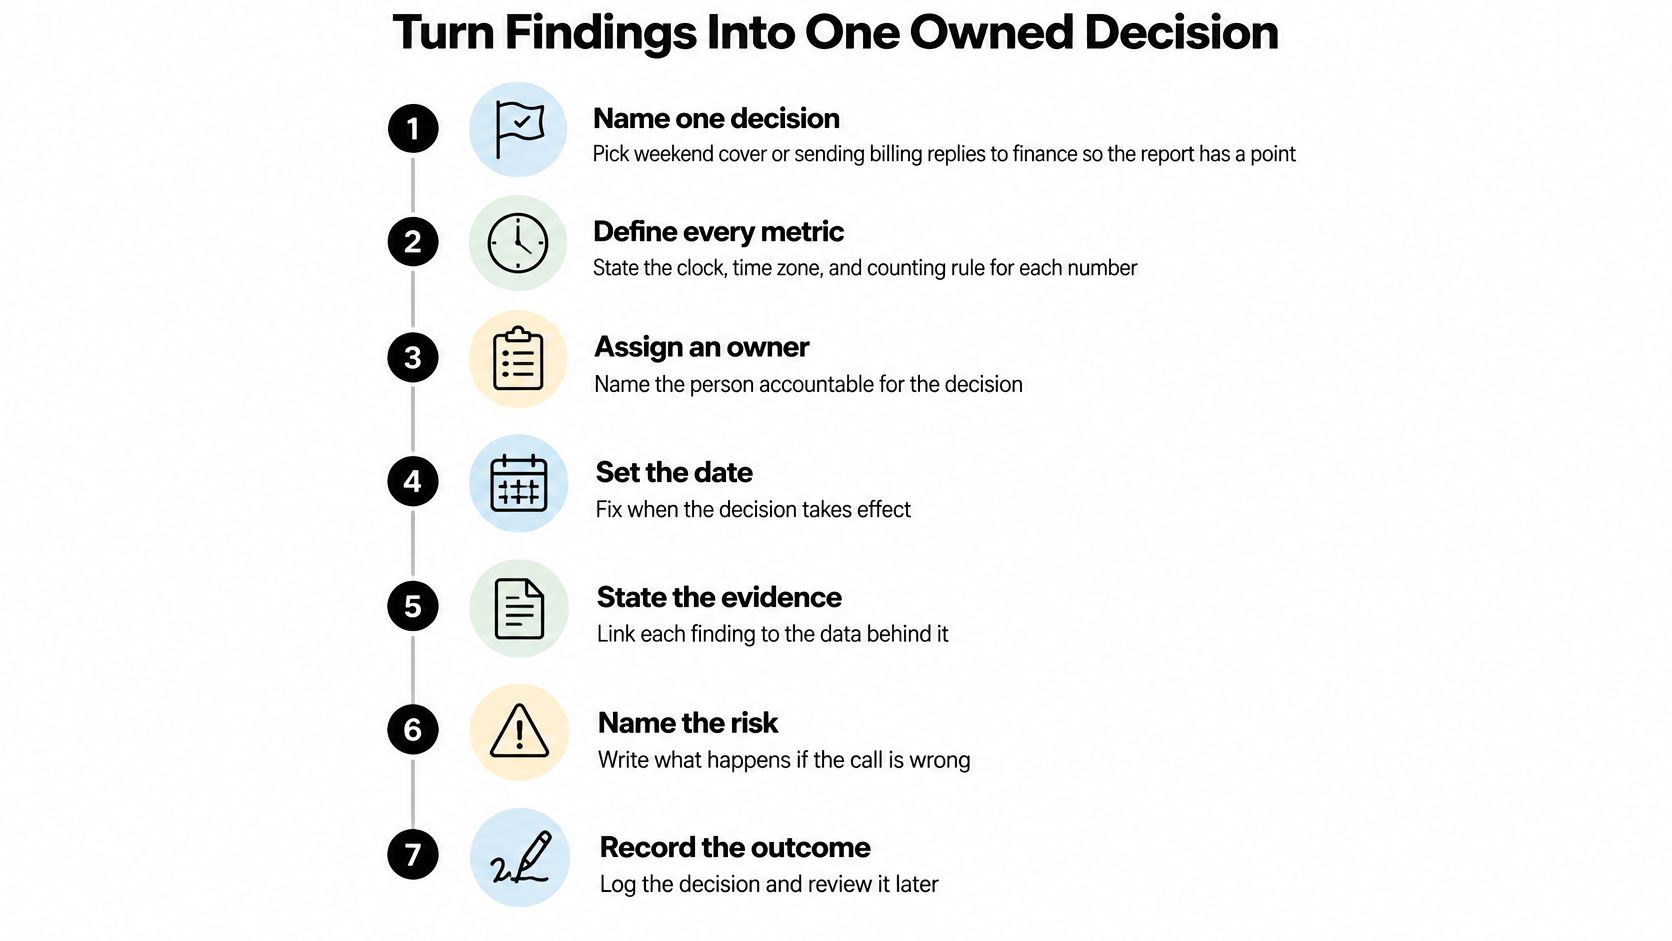
Name one decision. Choose weekend coverage or sending billing replies directly to finance. A report built around a specific choice is easier to challenge and act on than a general performance update.
Define every metric. Record its clock, time zone, denominator, and customer-wait pause rule. Otherwise, a definition change can masquerade as an improvement between periods.
Baseline the last full period and agree the target. Have the metric owner accept both the starting point and the intended result. Check data coverage before treating the baseline as reliable.
Read queues first, routing second, and executive trends last. Establish where work accumulates before deciding what it means for the business. This prevents a staffing gap from being framed as a brand problem.
Give every deviation an owner, corrective action, and validation date. Record when the change takes effect and the risk if it's wrong. An action such as review billing performance isn't specific enough; assign responsibility for reducing the unresolved finance queue.
Keep consequential decisions with people. Send refund disputes and safety reports to a person with the full thread attached. Hold low-confidence drafts for review, including cases involving ambiguous slang, sarcasm, or a potentially sensitive image.
Validate the outcome after two to four weeks. Treat that as a practical review interval, not a performance benchmark. Close the action only when the metric improves and the customer outcome holds.
Use this decision record to keep the evidence, authority, and follow-up together.
Make the first build deliberately small
Start with a month of work around that single decision. Prepare the scope, definition sheet, baseline, and named contacts for finance on billing, engineering on outages, comms on PR risk, and trust and safety on scam waves.
At Sift AI, our Team Time dashboard combines time in status across the team, live activity, and targets in one operational view. Our agents triage, route, research, and reply across social channels, while your business chooses what they do and when to step in. We flag low-confidence cases for your team, and sensitive conversations can move to a person with the context attached.
Review operations weekly, routing monthly, and executive findings quarterly. These are recommended working cadences, not reasons to delay urgent escalation.
Approval test: One decision, one owner, one validation date.
Copy that test into the planning note. Cut the draft back until it passes, and don't confuse implementing the action with proving it worked.
A Billing Spike and an Outage Surge in One Week
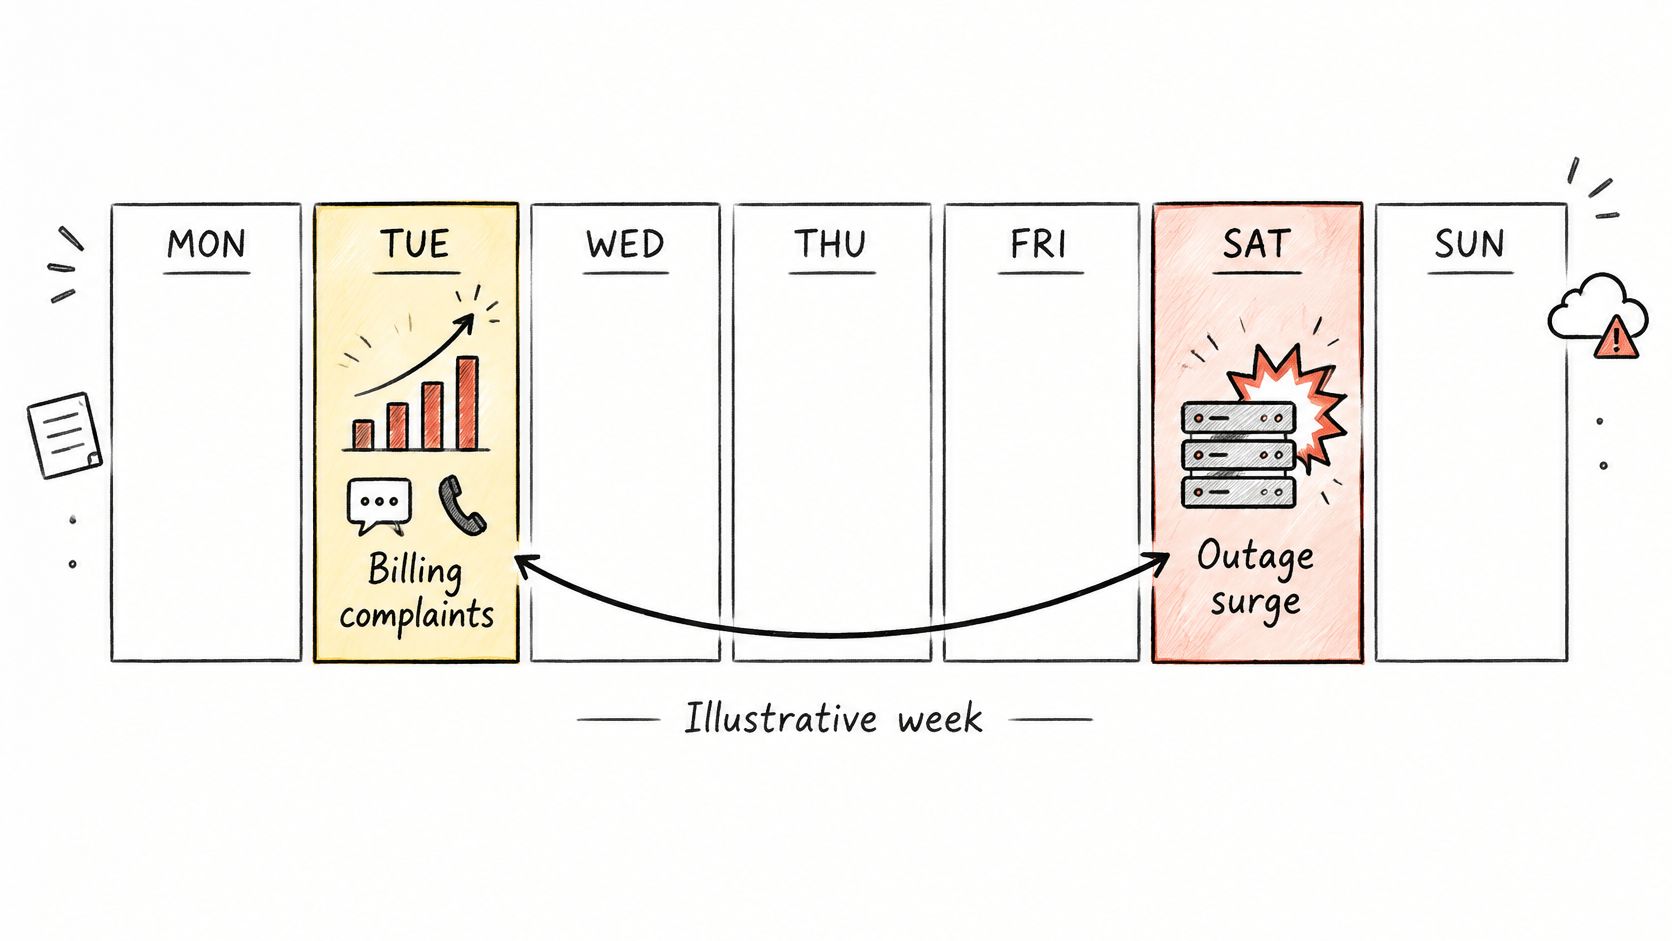
Consider this illustrative week, not a benchmark. After a pricing change, a brand's billing complaints in X replies and WhatsApp conversations climb about threefold.
The schedule helps distinguish the billing buildup from the later outage surge.
The backlog changes the staffing decision
The operational view shows billing backlog age rising from hours to two days, while detection-to-routing latency stays low. Cases are reaching finance promptly, so the lead investigates finance capacity rather than rewriting the routing rules.
The tactical view strengthens that diagnosis: finance first-response time breaches its target, and the billing escalation rate doubles. The finance owner agrees to a daily backlog target, while a revised billing reply template goes for review.
Later in the week, an outage produces a mention surge and more escalations to engineering and communications. Intent tags keep outage messages separate from billing complaints, preventing the new incident from distorting the billing trend.
The executive view shows severity-weighted impact concentrated in two regions. Engineering owns restoration updates, and comms receives the outage holding statement for approval rather than leaving social responders to improvise technical promises.
Use the video alongside the worked example to discuss how your team would record those handoffs.
Validation changes the next question
Two weeks later in this scenario, billing backlog age is back under a day, but billing repeat-contact rate remains flat. The capacity action helped the queue move, yet it hasn't demonstrated that customers received correct charges.
The lead samples returning cases and checks whether finance corrected the transaction or merely explained the pricing change. That finding determines whether the next action belongs to finance, product, or the owner of the reply guidance.
The team doesn't declare the billing problem solved. It records the queue improvement separately from the unresolved outcome, keeps an accountable owner, and sets another validation date.
Sift AI brings social and community work into a unified inbox, with AI-assisted triage, routing, reply drafting, and analytics while your team owns consequential decisions. Visit Sift AI to map a reporting workflow around a real queue, a named owner, and an outcome you can verify.