Customer Support Metrics That Actually Drive Social Care
"Master customer support metrics for social and community care — definitions, formulas, benchmarks and how to improve response time, FCR and SLA with AI."
Your X replies are full of “why was I charged twice,” Instagram DMs are asking for refunds in three languages, Discord has turned an outage thread into a meme wall, and Telegram is pulling in scam replies that look just real enough to fool a tired reviewer. Meanwhile, the dashboard says response time is “fine” because it blends everything together.
That's why support reporting often feels broken on social and community channels. Traditional helpdesk metrics assume a cleaner world. A ticket gets created, an agent responds, the issue gets resolved. Social care doesn't work like that. You're dealing with public replies, private DMs, duplicate complaints, pile-ons, feature requests disguised as bug reports, and a flood of pure noise that should never count as support demand in the first place.
Teams usually notice the problem during a surge. A billing incident hits. Mentions spike. The queue fills with screenshots, sarcasm, tag-your-friend jokes, and copy-pasted complaints. If all of that enters the denominator, your customer support metrics get distorted fast. First response time looks worse than it is. SLA misses look like staffing failure when the issue is weak filtering. Escalation rate climbs because agents are triaging in real time instead of working the right cases first.
Social support needs a different frame. Start with signal, not raw volume. Define what counts as a support interaction. Separate brand chatter from actionable cases. Then measure speed, quality, and routing accuracy on the work humans need to handle.
That's also why more teams are borrowing ideas from text analysis and classification work outside support. If you want a compact example of how small teams can structure messy language data before they report on it, ELECTE's piece on strumenti di analisi testuale PMI is a useful parallel. The lesson applies directly to social care. Clean the input before you trust the output.
Table of Contents
- Introduction Why Social Support Metrics Feel Broken
- What Counts as a Support Interaction on Social and Community
- Essential Customer Support Metrics Definitions and Formulas
- Channel Specific Targets and Why Blended Averages Mislead
- Benchmarks and Diagnostics How to Read Your Metrics Together
- How to Instrument Measure and Report Metrics Without the Chaos
- Improving Metrics With Orchestration and What to Do Next
Introduction Why Social Support Metrics Feel Broken
The queue is lying to you
A social care queue can look busy without being useful. Raw mentions aren't the same as support demand, and social platforms create more false positives than most helpdesks were built to handle.
A product delay can generate hundreds of posts that all point to the same root issue. A creator can quote-post your brand and send a swarm of jokes into your inbox. During an outage, one customer may comment on X, DM on Instagram, and join a Discord thread about the same incident. If every touchpoint counts as a fresh case, your metrics punish the team for the shape of the channel.
Practical rule: If your denominator includes spam, duplicates, pile-on chatter, and low-intent mentions, every downstream KPI gets noisier.
Social support diverges from classic ticketing. On email, the contact itself usually signals intent. On social, intent has to be interpreted. “Fix your app” under a viral post might be a real support request, a joke, or a public escalation that belongs with comms until support can verify details.
Metrics fail when ownership is blurry
Another reason the numbers feel off is routing. Social teams often receive work that belongs to several functions at once.
Consider a few common examples:
- Billing complaints in public replies: Support needs to acknowledge, finance may need to review charges, and comms may need a holding statement if the thread is gaining traction.
- Feature requests buried in DMs: Product should see the signal, but support may still need to respond and set expectations.
- Scam waves in comments: Trust and safety owns the pattern, but frontline reviewers are usually the first to see it.
- Outage reports with screenshots: Engineering needs context. Support needs the customer list. Social needs a pinned response.
If your tooling can't separate those paths, your metrics collapse into a vague story about “volume.” That isn't enough for the ops lead trying to explain SLA misses to executives or reviewer fatigue to the people setting headcount.
What better reporting looks like
Useful customer support metrics for social care start with orchestration. A unified inbox pulls in X, Instagram, TikTok, Discord, Telegram, WhatsApp, and forum traffic. AI filters obvious noise, tags intent and urgency, and routes cases to support, product, comms, finance, or trust and safety. Humans still approve responses, handle edge cases, and make the hard calls.
That changes the whole measurement model. You stop asking only “How fast did we reply?” and start asking “How much of the queue was actionable, how accurately did we route it, and how quickly did the right team respond?”
What Counts as a Support Interaction on Social and Community
Before you calculate anything, define the unit of work. On social and community channels, that's harder than it sounds.
A support interaction is not every inbound message. It's an inbound item with enough customer intent, context, and actionability to require review or response from a team that owns service, operations, risk, or product follow-up.
Start with raw volume, then strip out static
Think of your inbound flow as radio traffic. Some signals matter. Some are static. If you measure both together, you get a dashboard that looks precise but behaves badly.
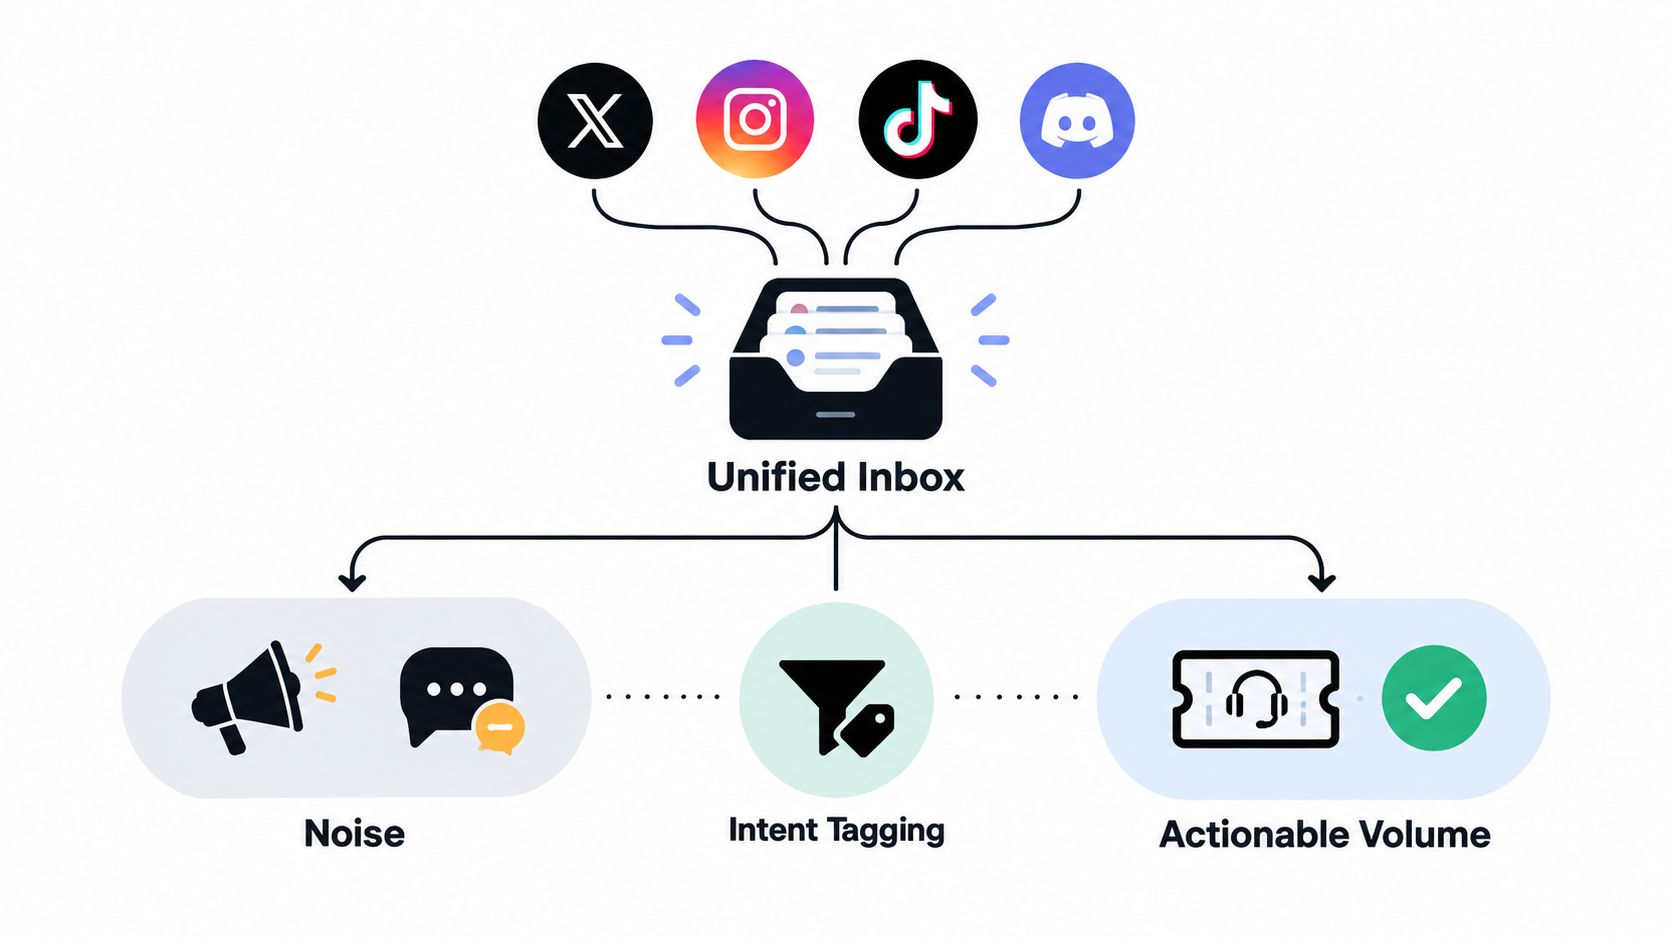
A workable classification model usually starts with these buckets:
- Noise: Spam, scams, bot replies, memes, unrelated mentions, duplicate reposts, and casual conversation that doesn't require action.
- Actionable support: Billing issues, login failures, order problems, account access, outage reports, refund requests, and policy questions.
- Actionable non-support: PR risk, media requests, abuse reports, legal threats, feature requests, partnership asks, and product feedback.
The key is that only some of these belong in support performance reporting. If a TikTok comment says your latest feature is “mid,” that may matter to insights. It shouldn't inflate support backlog.
Intent tagging changes the denominator
Many teams go wrong. They create KPIs first, then argue about edge cases later. The opposite works better.
Build your intent taxonomy before your dashboard. For social care, that usually means tagging for issue type, urgency, channel, language, customer status when available, and destination team. The taxonomy doesn't need to be academic. It needs to be stable enough that two reviewers would sort the same message the same way most of the time.
For example, “charged twice and no one answered my email” could carry tags for billing, escalation risk, public complaint, and finance routing. “App down?” under a flood of similar posts during an outage may be grouped under incident reporting rather than treated as a standalone mystery.
The moment you filter noise and define intent, your response time becomes a measure of operations instead of a measure of chaos.
Count cases, not just messages
Social channels tempt teams to count every touch. That inflates demand and masks duplicate work.
Use a case logic that can group related touches when they refer to the same issue and customer. One person can create multiple messages across platforms. One outage can create thousands of near-identical pings. One scam wave can produce a flood of reports that all point to the same moderation and trust workflow.
A cleaner measurement setup usually includes:
- Raw inbound count for workload visibility.
- Noise-filtered actionable volume for support operations.
- Case volume for actual queue management.
- Cross-functional routed volume for what left support and where it went.
That structure gives social ops a denominator worth trusting. Without it, every later metric becomes a fight about counting, not performance.
Essential Customer Support Metrics Definitions and Formulas
Once you've defined a real support interaction, the classic metrics become useful again. Not perfect. Useful.
Social and community operations need the same core customer support metrics as any service function, but each one needs channel context. A DM thread, a Discord post, and an Instagram comment don't behave like email tickets, even when the issue is the same.
The core set that actually matters
| Metric | Formula | What It Tells You |
|---|---|---|
| First response time | Time from case creation to first meaningful reply | How quickly the team acknowledges a case |
| Resolution time | Time from case creation to closure | How long it takes to fully resolve the issue |
| SLA compliance | Tickets resolved within SLA ÷ total tickets × 100 | The share of cases handled inside commitment windows |
| First contact resolution | Share of issues solved in one interaction | Whether the team solved the problem without repeat contact |
| Escalation rate | Percentage of tickets passed beyond first-level support | How often frontline teams need specialist help |
| Auto-closure rate | Share of cases closed without human follow-up after defined criteria | How much low-risk work the workflow can safely close |
| CSAT | Survey-based satisfaction after an interaction | How customers rate the support experience |
| Customer effort | Survey-based ease of getting help | How hard the resolution felt from the customer side |
Speed metrics need a meaningful start and stop
First response time is one of the most watched metrics because it tells you whether customers are being acknowledged quickly. In SLA terms, response time means the time until the first meaningful acknowledgment, not full resolution, as Front explains in its guide to SLA metrics in customer service.
For social care, “meaningful” matters. An auto-like on a post isn't a response. Neither is a generic bot line that doesn't move the case forward. If the customer shared a fraud concern, “we've received your message” may be enough to stop public escalation, but it still has to count as a real acknowledgment with ownership.
Resolution time should track when the issue is closed, not when the social team moved it to another queue and forgot about it. If engineering owns the fix but support owns the customer relationship, your close logic should reflect both.
Formula: SLA compliance = tickets resolved within SLA ÷ total tickets × 100. That formula is commonly used in support reporting, including Gorgias's overview of customer support metrics.
Quality metrics beat pure speed
First contact resolution is the metric that keeps speed honest. Benchmark summaries place average FCR around 68% to 76%, with 70% to 79% considered good and 80%+ considered world class, according to call center KPI benchmarks. That matters because unresolved work doesn't disappear. It comes back as another DM, another mention, another “still waiting” comment.
On social, low FCR usually points to one of three things: weak macros, poor routing, or missing authority. If the social team has to bounce every billing case to finance and every technical case to engineering without context, FCR stays low no matter how fast agents reply.
Escalation rate helps identify where that handoff is happening. It shows the percentage of tickets passed beyond first-level support, which makes it useful for spotting training gaps, process issues, or the need to route cases to specialized teams, as noted in Curcle's write-up on SLA metrics.
Social nuance that standard dashboards miss
A few cautions matter in practice:
- Auto-closure rate is not a vanity win: It only means something if your close criteria are sound. Closing stale DMs after no reply can be sensible. Auto-closing unresolved public complaints is how you create repeat contacts.
- CSAT on social is sparse: Public channel users don't always complete surveys, so read CSAT as directional unless your sample is stable.
- Effort often explains more than sentiment: A customer may accept a slow answer if the path was clear, but they won't forgive bouncing between social, email, and a community forum.
For teams that also track audience performance, keep support metrics separate from marketing engagement. If someone on your team needs a clean refresher on how social interaction ratios work, this guide from revid.ai on engagement rate is useful, mostly as a reminder that engagement is not the same thing as support demand.
Channel Specific Targets and Why Blended Averages Mislead
A single average across email, live chat, phone, and social is one of the fastest ways to hide service problems.
Customers don't experience channels the same way, so they don't judge delay the same way either. A five-minute wait can be harmless in one channel and unacceptable in another. Yet many reports still mash everything into one response-time number and call it operational clarity.
The benchmark gap by channel
Published benchmark summaries commonly cite under 1 hour for email, under 30 to 40 seconds for live chat, about 80% of phone calls answered within 20 seconds as a classic service-level target, and about 1 hour during business hours for social support, according to this summary of first response time benchmarks for customer support.
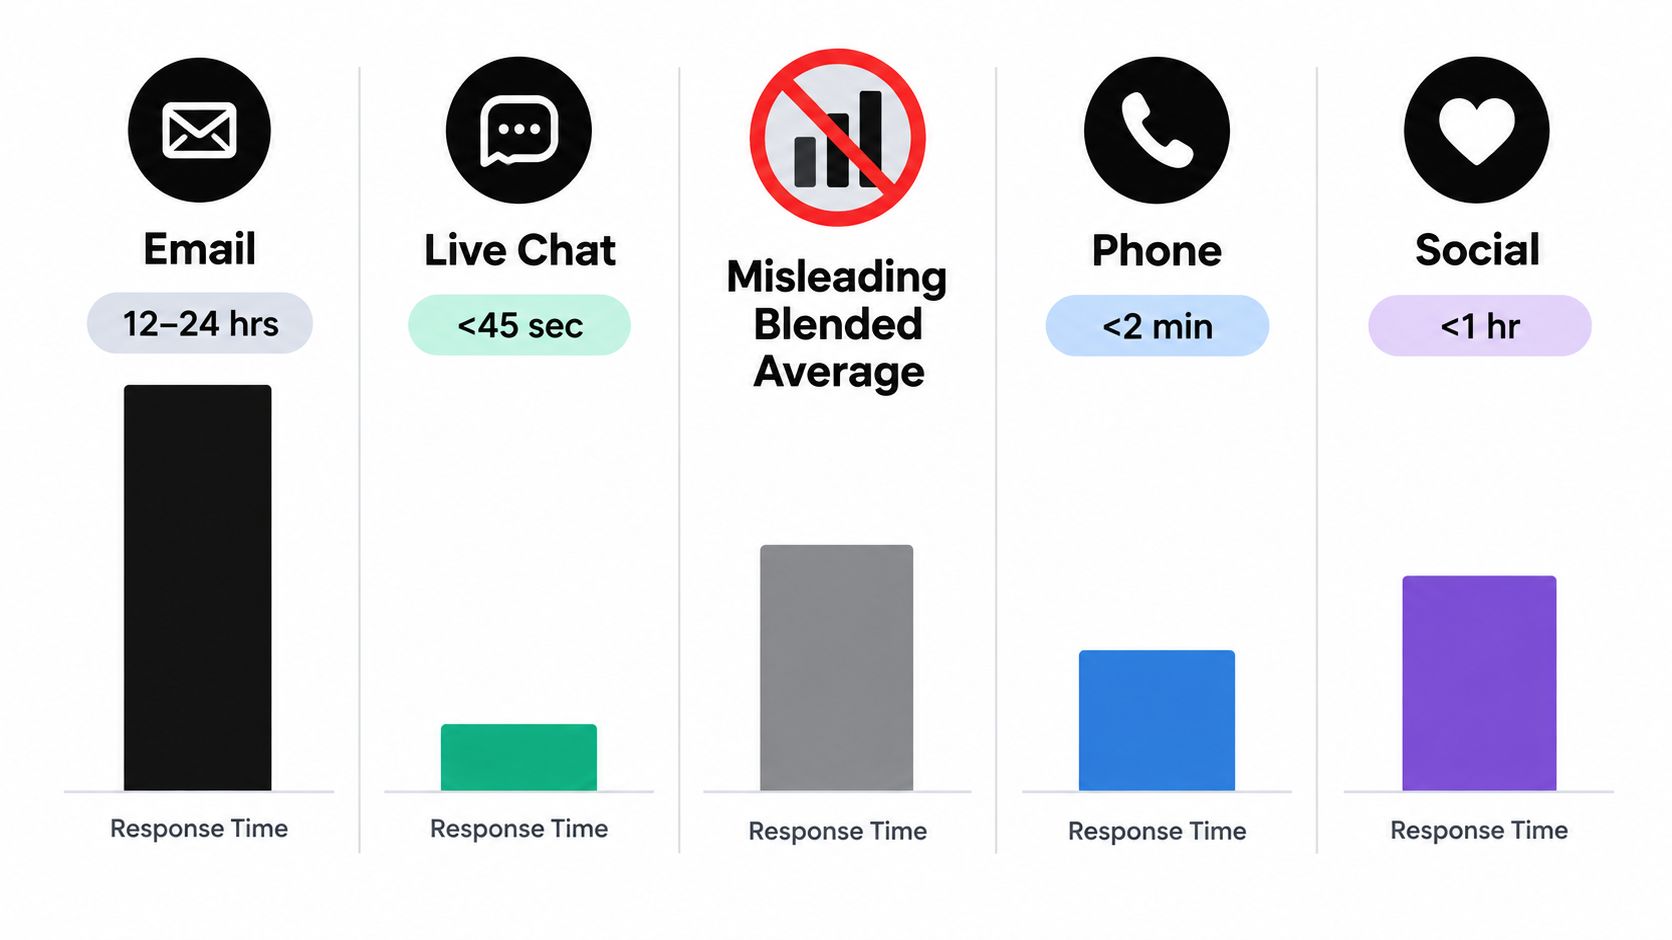
Those differences aren't cosmetic. They reflect customer intent and tolerance. Live chat implies immediate help. Phone implies queue discipline. Social often starts in public, which means delay can become reputation risk before it becomes a support problem.
The operational takeaway is simple. Track first response time, service level, and abandonment rate by channel. Don't let a blended average hide the fact that your chat queue is underwater while email is cruising.
Why blended reporting creates false comfort
A blended average can look healthy while one channel burns. That usually happens when slower channels dilute faster ones or vice versa.
A common pattern looks like this:
- Email volume falls behind: It barely moves the total because social and chat are carrying more interactions.
- Live chat response slips: The blended average still appears acceptable because email is measured in hours.
- Phone stays on target: Leaders think service is stable, but social mentions are filling with “anyone there?”
This is why support organizations increasingly track first response time by channel instead of using one blended number. Channel norms are too different.
If your report says “average response time” without naming the channel, it's not a support metric. It's a blur.
Hitting targets without just adding agents
When teams miss response thresholds, they often ask for more headcount first. Sometimes that's right. Often it isn't the first fix.
Three levers usually matter more:
- Queue triage: Separate outage, billing, fraud, and VIP issues from routine chatter immediately.
- Routing rules: Send finance issues to finance, engineering incidents to engineering, and public-risk posts to comms without manual bouncing.
- Staffing alignment: Match channel coverage to when customers arrive, not when the org chart is convenient.
That's especially important on social, where volume can surge suddenly and publicly. Fast acknowledgment often comes from better routing logic before it comes from larger teams.
Benchmarks and Diagnostics How to Read Your Metrics Together
Metrics rarely fail because you picked the wrong formula. They fail because you read them one at a time.
A support dashboard becomes useful when it shows patterns across speed, quality, and trust. That's where diagnosis starts.
For baseline context, a widely cited benchmark says the average customer service email receives no reply in 62% of cases, and for organizations that do respond, the average email response time is 12 hours and 10 minutes, while 89% of customers expect a reply within one hour. The same benchmark notes that top-performing businesses can reply in under 1 hour. Those figures are summarized in Ringly's review of customer service response time benchmarks.
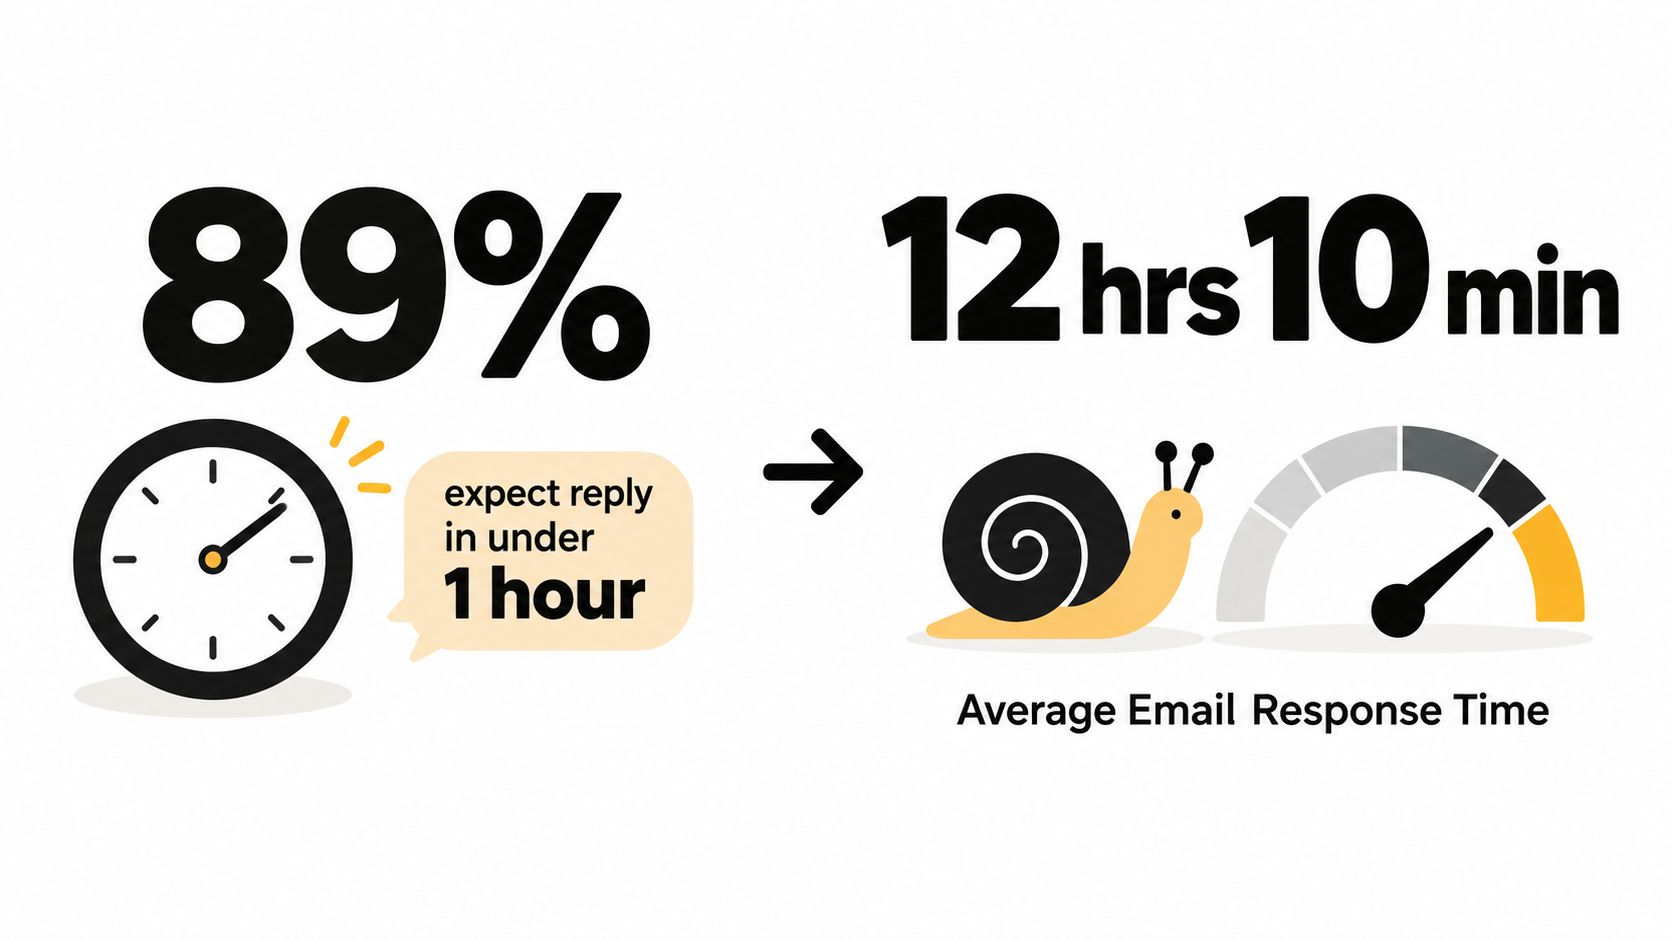
That gap is why response-time reporting became strategic. In a 2025 HubSpot survey, CSAT and retention were each named by 31% of customer service professionals as the most important CX metrics, while response time followed at 29%, according to HubSpot's roundup of customer service stats.
What combinations usually mean
Don't ask whether a single metric is “good.” Ask what the combination is telling you.
- High first response time plus high abandonment usually points to queue design or routing failure. Customers are waiting too long before anyone takes ownership.
- Fast first response time plus low first contact resolution often means the team is acknowledging quickly but not solving well. Macros may be shallow, permissions may be weak, or intent tagging may be off.
- High escalation rate with normal volume tends to indicate training gaps, fragile workflows, or case types that never should have landed with frontline social care.
- Low CSAT with acceptable speed usually means the issue was handled quickly but felt confusing, unfair, or repetitive to the customer.
Speed still matters, but understanding matters more now
There's also a shift happening in what customers value. A 2026 CX trend report found demand for “feeling understood” rose by 6 points, while the importance of speed fell from 14.5% to 10.2%. The same report says 95% of consumers want AI decisions explained but only 37% of companies do so, according to Glance's 2026 CX trends report.
That doesn't make speed irrelevant. It changes the hierarchy. A fast answer that feels robotic, evasive, or unexplained can still damage trust.
A short explainer on that tension is worth watching before you finalize your dashboard priorities:
Self-service can mask failure if you measure the wrong thing
Another trap is over-crediting self-service. Recent 2026 data says only 9% of customer journeys are fully contained in self-service even though 70% of customers use it, and the same benchmark says each failed interaction is about 80 times more expensive than automated support, as summarized by Wonderchat's review of customer support KPIs.
That's why “deflection” by itself is weak. In social care terms, a help-center link pasted into a reply isn't a win unless the issue ends there. Measure containment quality, not just handoff volume.
How to Instrument Measure and Report Metrics Without the Chaos
The cleanest dashboard in the world is useless if the operating model behind it is sloppy. Instrumentation decides whether your customer support metrics tell the truth.
For social and community teams, that starts at ingestion. Pull X, Instagram, TikTok, Discord, Telegram, WhatsApp, and forums into one queue so the team isn't measuring fragments in separate tools.
Build the workflow from intake to report
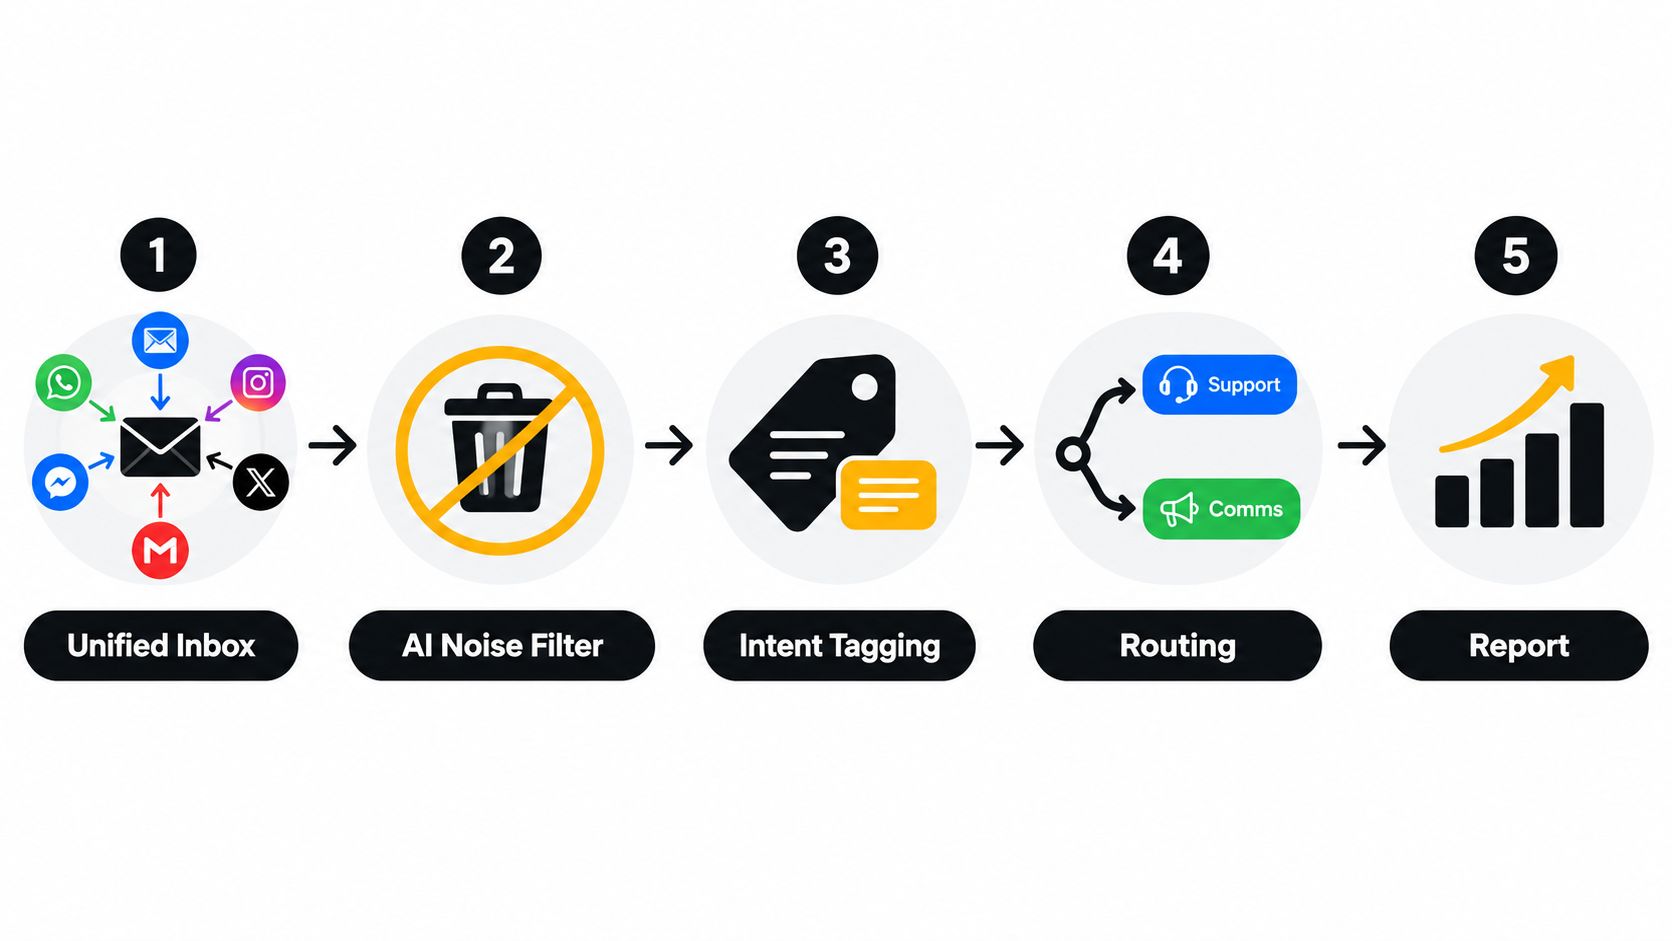
A practical setup looks like this:
Unified inbox intake
Capture public mentions, replies, DMs, community posts, and forum threads in one place. If reviewers are alt-tabbing between native apps, you'll lose timestamps, duplicate cases, and auditability.AI noise filtering
Remove obvious spam, scams, low-intent chatter, and duplicates before they hit the action queue. Tools like Sift AI fit. They unify social and community channels, filter noise, tag intent, route work to support, comms, product, or trust and safety, and draft replies while keeping humans in the loop.Intent tagging and priority logic
Apply labels for issue type, urgency, language, sentiment where useful, and destination team. Outage reports, suspected fraud, and billing complaints need different timers.Routing and escalation paths
Build direct lanes to finance, engineering, legal, comms, or trust and safety. Don't make social care manually re-explain the case every time it moves.Reporting and review
Roll up actionable volume, response time by channel, SLA compliance, escalations, auto-closures, and unresolved clusters into one view for ops and one lighter view for executives.
Set timers that reflect reality
One SLA rarely fits all inbound. Social operations work better with layered timers:
- By channel: Public social, DM, community thread, and forum post each behave differently.
- By severity: Outage, fraud, and legal-risk posts need tighter response rules than general feedback.
- By ownership: Cases routed to engineering or finance still need customer-facing accountability.
- By business hours: A social mention overnight may follow one rule, a live WhatsApp queue another.
This structure lets you report without gaming. You're not forcing every case into the same stopwatch.
Operational test: If a reviewer can't explain why a case started, paused, escalated, and closed, your reporting logic is too brittle.
Make the dashboard useful to two audiences
Ops leaders and executives need different views.
For the ops dashboard, include queue health, noise-filtered percentage, first response time by channel, SLA misses by reason, escalation rate by intent tag, and auto-closure review. You catch routing failures, reviewer overload, and platform-specific bottlenecks.
For executive rollups, keep it tighter. Show actionable demand trends, SLA compliance, major issue categories, cross-functional escalations, and where unresolved customer pain is collecting. Executives don't need every queue detail. They need confidence that the numbers reflect actual customer work and expose risk early.
Improving Metrics With Orchestration and What to Do Next
The fastest way to improve customer support metrics on social isn't telling agents to work harder. It's removing preventable work before it reaches them.
Orchestration does that. Noise filtering shortens first response time because reviewers aren't digging through junk. Better intent tagging improves first contact resolution because the case starts with context. Cleaner routing lowers escalation rate because finance, engineering, comms, and trust teams get the right work earlier. AI-drafted replies help with speed, but humans still need to approve the answer, adapt tone, and own exceptions.
That human ownership matters even more as AI spreads through support. Customers increasingly want decisions explained, not just delivered. If your workflow can automate acknowledgment but can't explain why a refund was denied, why an account was flagged, or why an outage update changed, the dashboard may look efficient while trust erodes.
A practical next-step checklist:
- Audit the denominator: Separate raw inbound from actionable support volume.
- Split reporting by channel: Stop using blended averages as your main speed metric.
- Review routing paths: Check where cases bounce between social, finance, engineering, and comms.
- Pair speed with quality: Put first contact resolution and escalation rate next to response time.
- Add trust signals: Track explainability, customer effort, and repeat-contact patterns where possible.
- Inspect auto-closures: Make sure closed cases are resolved, not just quiet.
The teams that get this right don't replace humans. They protect human judgment by automating the noise around it.
Sift AI gives social care and community operations teams a unified inbox across social channels and forums, plus AI that filters noise, tags intent, routes work to the right team, drafts replies, and surfaces analytics tied to SLA and response performance. If you need customer support metrics that reflect real social demand instead of inbox chaos, visit Sift AI.