Social Media Analytics for Business: What to Measure
"Social media analytics for business explained: which metrics matter, who owns them, how to set up routing and dashboards, and where teams go wrong."

Say a billing complaint sits in your brand's replies for nine hours. Your dashboard still shows healthy engagement, a steady post count and no obvious problem. You're preparing the executive update, but the customer is waiting for finance, and nobody owns the handoff.
That's the problem with measuring activity without measuring what happens next. For social operations and insights leaders, social media analytics for business needs to explain which signals received action, whether that action worked and what evidence supports the business result.
Table of Contents
- What Social Media Analytics for Business Really Means
- Key Metrics and the Business Questions They Answer
- Mapping Metrics to Objectives and Owning Teams
- How to Build the Analytics Pipeline Step by Step
- Dashboards and Reporting Cadence Executives Trust
- Worked Examples From Billing, Outage and Scam Waves
- Common Pitfalls That Quietly Skew Social Analytics
- Choosing Tools and Confirming Your Next Step
What Social Media Analytics for Business Really Means
Social media analytics for business is the practice of tracking social signals across channels, connecting them to operational actions and measuring the resulting business outcomes. Those outcomes might include revenue protected, service cost avoided, customers retained or risk reduced. Counting interactions is useful, but it doesn't establish any of those results.
A fire alarm log tells you that the alarms rang. It doesn't tell you whether anyone evacuated, whether responders arrived or whether the building was safe afterward. A dashboard of mentions and replies has the same limitation when it stops at detection.
The operating view needs to include both the conversation and the work behind it.

Follow the evidence beyond the inbox
The measurement gap is substantial: Sprout Social's 2025 survey of 1,200 global marketing leaders, summarized by Net Influencer, found that 56% believed social media drives revenue, but only 44% considered their teams experts at measuring business impact, and fewer than half said social data was embedded in CRM systems.
More charts won't fix a missing connection between systems. A complaint in an Instagram reply needs a conversation identifier, an owner, action timestamps and a resolution record. If you want to associate that resolution with retention, you also need an appropriate connection to the customer record.
The same principle applies to direct messages, community threads and forum questions. Care might handle the conversation while finance approves a refund, engineering fixes a defect, product evaluates a feature request or communications approves a statement.
Working rule: Record the action and its evidence, not just the message that triggered it.
Keep evidence strength visible. A completed refund is an observed result; a customer remaining active afterward is an association; a claim that the intervention prevented cancellation needs a credible comparison. Private sharing, multiple touchpoints and identity gaps limit what you can attribute.
The working definition is straightforward: a signal, a named owner, an action and a measured outcome. If any link is missing, report the gap rather than substituting engagement for business impact.
Key Metrics and the Business Questions They Answer
Measure what each metric answers, not what's easiest to count. In 2025, 68% of surveyed marketing leaders said their social teams used engagement to measure effectiveness, while 65% used conversion rates, according to Sprout Social's report covered by Chief Marketer. Neither measure tells an operations leader whether genuine requests went unanswered.
Start with triage workload, then coverage, speed, quality and value. Keep marketing performance alongside operational performance, not in place of it.
Core social analytics metrics and what they answer
| Metric | What It Tells You | Use It For | Watch Out For |
|---|---|---|---|
| Noise-filtered percentage | Share of mentions dismissed as spam, duplicates or low-intent posts | Sizing triage workload | A high share can hide genuine complaints that were filtered out |
| Auto-closure rate | Share of conversations closed without a human reply | Measuring automation scope | Closure without a correct answer inflates the rate |
| Time to first human response | Elapsed time before a person replies | SLA compliance by channel | Averages hide the long tail of waiting customers |
| Time to qualified resolution | Time until the issue is actually solved | Service quality | Needs a shared definition of resolved |
| Reopen rate | Share of closed conversations that return | Resolution quality | Rises when auto-closure is too aggressive |
| Escalation precision | Share of escalations that reached the right owner | Routing accuracy | Escalation volume alone rewards over-routing |
| Sentiment change after resolution | Shift in tone from first message to last | Customer experience | Sarcasm, slang and memes need language-aware models |
| Proactive saves | Issues fixed before they became complaints or cancellations | Risk and retention | Attribution needs a holdout group |
| Engagement rate | Likes, comments and shares per post, normalized using a declared denominator | Content performance | Doesn't show customer demand or service cost |
| Conversion rate | Share of social visitors completing a goal | Marketing revenue | Misses cross-touchpoint influence |
For engagement rate, declare whether you divide interactions by impressions, reach or audience size. Don't combine rates calculated with different denominators into an apparently comparable channel ranking.
Coverage needs a companion measure: unanswered genuine requests. Count eligible customer requests with no appropriate response, including those incorrectly filtered or left between queues. Otherwise, your speed report describes only the customers you chose to serve.
Make the denominator auditable
Define the eligible population for every rate. Auto-closure should use conversations, not individual messages; reopen rate needs a stated observation window; escalation precision requires reviewers to confirm the destination was appropriate.
For mission-led organizations, Bruce and Eddy's guide to social media measures for nonprofits offers a useful companion perspective when selecting goal-specific measures. Keep those organizational goals distinct from inbox service commitments.
Cost per resolution also needs an honest numerator. Include reviewer time, repeat handling and tooling costs rather than treating automated messages as free resolutions.
Dashboard admission rule: A metric earns its place only if a named person can act on it within a week. Measures used for longer-term executive decisions belong in the investment report, not the shift lead's action queue.
Mapping Metrics to Objectives and Owning Teams
A spike in mentions containing refund means different things to different owners. Finance sees a billing obligation, engineering may see a checkout defect and communications sees a potentially public dispute. Sending every mention to all those teams creates reviewer fatigue without establishing accountability.
Assign a primary resolution owner and separate supporting tasks. Finance can own the refund while engineering investigates the defect and communications monitors amplification. The customer shouldn't have to coordinate those teams.
Analytics ownership by team
| Team | Business Objective | Signals They Watch | Decision a Human Owns |
|---|---|---|---|
| Social care | Faster, accurate resolution | Time to first human response, reopen rate, escalation precision | Whether to offer a credit or follow-up call |
| Finance | Billing accuracy and revenue protection | Billing complaints by plan, refund requests, duplicate-charge mentions | Refund approval and policy exceptions |
| Engineering | Fast defect and outage response | Error keywords, outage-related mention spikes, affected regions | Severity rating and incident declaration |
| Product | Feature demand and retention | Feature requests in DMs, recurring complaints by feature | Roadmap priority |
| Communications and PR | Reputation protection | Negative mention share, influencer amplification, public threads | Public statement and tone |
| Trust and safety | Fraud and impersonation control | Scam wave clusters, impersonation reports, suspicious links | Account action and customer warnings |
| Insights leadership | Executive reporting and investment decisions | Noise-filtered percentage, proactive saves, cost per resolution | Staffing and budget changes |
Routing accuracy isn't just whether the system selected a valid department. Review whether that department could act, accepted ownership and avoided sending the customer elsewhere. Track reassignment reasons so you can distinguish a bad tag from an unclear policy.
Care retains responsibility for customer updates unless another owner explicitly accepts that responsibility. Internal assignment alone doesn't count as customer progress.
Give fraud a separate lane
A September 2025 survey of 1,000 U.S. adults who had used Facebook, documented in Zelle's social media scams fact sheet, found that 79% reported seeing scams on Marketplace, while 14% of Marketplace shoppers said they had been scammed. Those findings concern Marketplace, not every brand's social audience, but they illustrate why scam reports need more than a negative-sentiment tag.
Keep scam volume, confirmed incidents, escalations and false positives separate. A repeated suspicious link can generate a large cluster without representing an equal number of confirmed victims.
AI can group impersonation reports and identify suspicious payment requests. Humans should decide account action, customer warnings and public crisis responses, especially when mistaken identification could harm a legitimate user.
An accepted assignment is an ownership event. A forwarded message is not.
Maintain a shared metric dictionary defining resolved, escalated and high severity. Hold a monthly ownership review where each team reports a decision the evidence changed, such as a refund-policy clarification, defect priority or routing-rule revision.
How to Build the Analytics Pipeline Step by Step
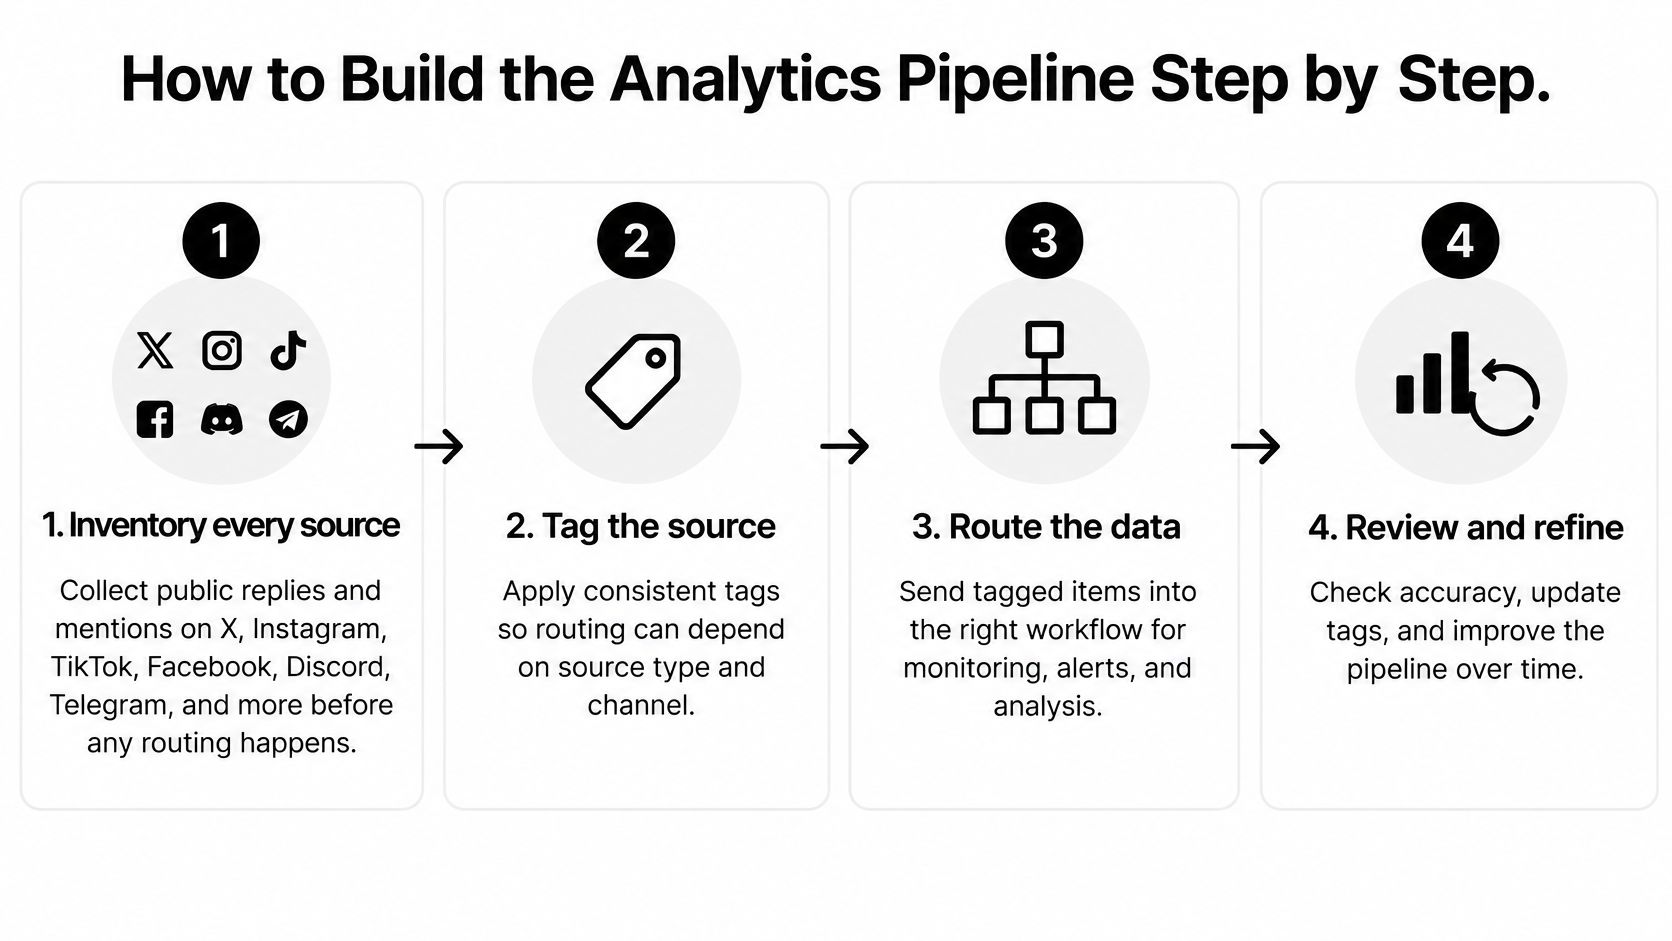
Build the pipeline in dependency order. Routing depends on reliable tags, tags depend on source context, and outcome reporting depends on preserving identifiers through every handoff. Connecting dashboards before those foundations produces polished reports with weak evidence.
Use this flow as the operating outline.
Establish sources, tags and ownership
Inventory every source. Include public replies and mentions on X, Instagram, TikTok and Facebook; conversations in Discord, Telegram and WhatsApp; forum questions; and permitted direct messages. Map CRM tickets and product-feedback records too, noting connector access limits so missing coverage isn't mistaken for silence.
Build the tag taxonomy. Use distinct layers for intent, severity and language, with intents such as billing, outage, feature request, scam and praise. Preserve the source channel and original message context, and allow reviewers to correct tags without erasing the original classification.
Write routing rules. Send billing complaints to finance, outage signals to engineering, reputational threats to communications and fraud patterns to trust and safety. Give every queue a named human owner, acceptance rules and a fallback when the owner is unavailable.
Set SLAs by channel and market. Use customer expectations as context, then choose commitments your staffing and escalation coverage can support. The historical Oracle social engagement survey reported the channel and regional expectations below; treat them as planning context, not current universal targets.
Channel expectations for response time
| Segment | Expectation | Share |
|---|---|---|
| Twitter users | Reply within 30 minutes | 30% |
| Twitter users | Reply within two hours | 22% |
| Twitter users | Reply within the same day | 29% |
| Facebook users | Reply within two hours | 29% |
| Latin American respondents on Twitter | Same-day reply | 65% (38% worldwide) |
| Latin American respondents on a company Facebook page | Same-day reply | 77% (51% worldwide) |
Connect outcomes and audit the workflow
Connect CRM and product data. Carry the conversation identifier into the ticket, incident or feedback record. Restrict customer-level joins to appropriate access and purpose, and label unmatched records rather than guessing identities.
Publish the metric dictionary. Specify denominators, timestamp events, exclusions, business-hours treatment and the evidence required for qualified resolution. Version definition changes so apparent improvements don't come from moving the goalposts.
Build role-based dashboards. Show actionable queue detail to operators and outcome summaries to leadership. Preserve drill-through access for authorized reviewers investigating a misleading aggregate.
Schedule monthly tagging audits. Sample multilingual slang, image-based threads, sarcasm and closed conversations alongside ordinary text. Record corrections by intent and language so aggregate accuracy doesn't conceal weak categories.
Add high-volume and confirmed-crisis escalation tiers. Configure brand-term spikes or legal, safety and press-risk signals to page communications and the on-call owner within minutes; a human confirms crisis status and decides whether to issue a holding statement. Log when each tier was reached.
A common routing failure deserves an explicit test: moving a public complaint straight into DMs without acknowledgment. Keep the public-response approval gate visible instead of assuming the private assignment completed the handoff.
Dashboards and Reporting Cadence Executives Trust
A shift lead needs to know which queue is about to breach its SLA. An executive needs to know whether the operating model merits more investment. Giving both the same dashboard forces one audience to search through irrelevant detail.
Separate the reporting layers by the decisions people can make. Keep definitions consistent across layers, but change the level of detail and review rhythm.
Reporting cadence by audience
| Cadence | Audience | Core Content | Decision It Drives |
|---|---|---|---|
| Real-time | Shift leads | Queue depth, backlog age, spike alerts | Staffing shifts and immediate escalations |
| Daily | Care and comms managers | SLA attainment, unanswered-question rate, escalation counts | Queue rebalancing and holding statements |
| Weekly | Product, engineering, finance | Feature-request clusters, billing complaint themes, outage mentions | Fix priority and roadmap input |
| Monthly | Operations and insights leaders | Automation quality scorecard, noise-filtered percentage, proactive saves | Tag rule changes and automation scope |
| Quarterly | Executives | Cost per resolution, retention-linked outcomes, confidence levels | Budget and headcount decisions |
In real time, emphasize the oldest actionable work, not just total queue size. A short queue containing an unattended safety complaint may require more intervention than a large queue of low-urgency questions.
Daily reviews should identify service gaps and assign recovery actions. Weekly reviews should turn conversation clusters into accepted work, with links to the engineering issue, finance investigation or product decision.
Report automation quality before automation scale
The monthly scorecard should combine safely auto-resolved percentage, human-escalation precision, repeat-contact rate and correction rate. Break those measures down by language, channel and severity, and distinguish verified resolution from merely automated closure.
Coverage deserves attention from the start: a study of major UK companies summarized in the Hootsuite social customer service white paper found that 76% maintained a Twitter presence, yet only 39% answered customer-service questions. This older, channel-specific benchmark is a diagnostic baseline, not a target for today's operation.
Track unanswered-question rate from the first week of your rollout. Pair it with the eligible-request count so leaders can tell whether coverage improved or incoming demand changed.
Quarterly reports should distinguish observed outcomes from estimated contribution. Show retention-linked results with cohort definitions, missing-record coverage and attribution limits; calculate cost per resolution on consistent labor and tooling assumptions.
Reporting test: Every chart must name the decision it is expected to trigger.
If nobody can describe the action, move the chart to an exploratory workspace. An executive report should support a staffing, policy or investment decision, not serve as an inventory of everything the platform can count.
Worked Examples From Billing, Outage and Scam Waves
These are illustrative scenarios, not customer case studies. Each follows the same sequence: signal, owner, action and outcome evidence.
The workflows below show where machine assistance ends and accountable human decisions begin.
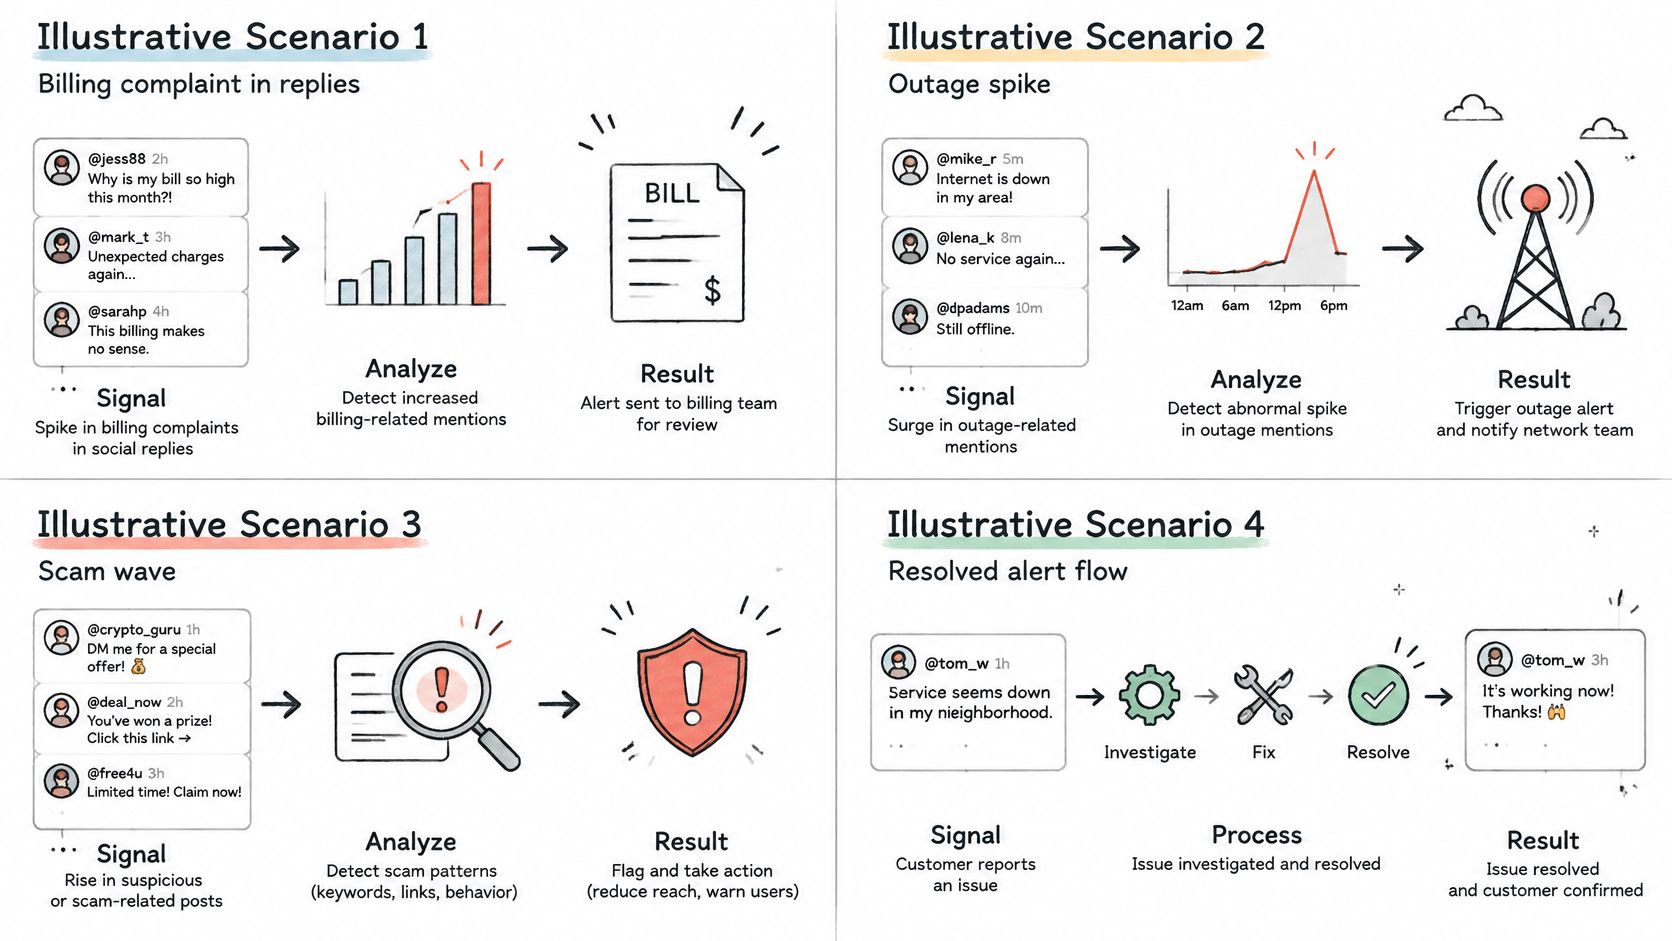
Illustrative scenario one, A duplicate-charge complaint
Replies to a brand's post say a customer was charged twice. The system tags billing with high severity and routes the issue to finance, while care retains responsibility for the public conversation.
AI drafts a brand-voice acknowledgment; a human approves it, then moves account details into a private message. That acknowledgment matters: 51% of consumers who contact a brand publicly expect a public acknowledgment before moving to a private direct message, according to a survey reported by Sprout Social.
Measure time to first human response and time to refund resolution. The outcome evidence is the finance record confirming the refund, not the reassuring wording of the reply.
Illustrative scenario two, Login failures across channels
Say mentions and Discord posts about login failures rise sharply within an hour. The system clusters matching symptoms, routes the incident candidate to engineering and alerts communications without treating each duplicate as a separate investigation.
An engineer declares the incident and communications approves customer updates. Measure elapsed time from the first detected spike to incident declaration, then record affected accounts helped proactively; treat avoided complaints or cancellations as estimated saves unless comparison evidence supports attribution.
For a complementary workflow walkthrough, use the video below.
Illustrative scenario three, Fake support accounts
A wave of fake support accounts appears on Instagram and WhatsApp, asking customers to follow payment links. The system groups related handles, language patterns and destinations, then routes the cluster to trust and safety.
A human validates the evidence and approves reporting actions and customer warnings. Count observed scam messages, confirmed incidents and false positives separately; preserve evidence without exposing suspicious links in public replies.
Illustrative scenario four, Feature requests buried in DMs
Customers ask for a missing export feature in direct messages. Intent tagging and weekly account-level counts show product which requests cluster among accounts already flagged as at risk.
A product manager evaluates priority, while care sets expectations without promising an unapproved release. Measure accepted feedback, delivery status and subsequent account outcomes separately, rather than declaring every acknowledged request a retention win.
Each scenario produces a different result record. The analytics become useful when the responsible owner can show what changed, not merely that a conversation passed through the inbox.
Common Pitfalls That Quietly Skew Social Analytics
The most dangerous dashboard is green while customers remain unserved. A healthy median can coexist with billing complaints waiting most of a day, particularly when fast, low-risk conversations dominate the report.
A survey-based study of 230 social-media users found a statistically significant association between response time and satisfaction. That observational finding supports treating elapsed time as a service-quality variable, but it doesn't prove that speed alone causes satisfaction.
Diagnose the symptom before changing the target
| Symptom | Likely Measurement Failure | Practical Correction |
|---|---|---|
| Response time looks healthy while complaints age | Averages mask the waiting tail | Inspect percentiles and oldest requests by intent |
| Closures rise alongside reopens | Closure is mistaken for resolution | Audit closed threads against outcome evidence |
| Engagement grows while service coverage falls | Interactions are mistaken for customer demand | Separate promotional engagement from genuine requests |
| Language-level performance diverges | Tags drift across slang and local context | Review original messages with qualified language reviewers |
| Negative sentiment spikes during impersonation waves | Fraud is counted as ordinary dissatisfaction | Apply fraud-specific labels and validation |
| Retention improves after a workflow change | Correlation is presented as proof | Use a comparison design and state uncertainty |
Segment time to first human response, time to qualified resolution, reopen rate and satisfaction by response-time bucket, intent, urgency, platform and language. This lets you inspect whether a slower billing queue has different outcomes from a similarly slow feature-request queue.
Don't stop the clock when the conversation is assigned internally. If the customer is still waiting for a meaningful response or qualified resolution, the operational delay remains real.
Fast automation can still be poor service
Consumer preferences complicate a speed-only strategy: 67% prefer a human over AI for social-media support, while another 2025 study found that 47% would rather wait longer for a more human and empathetic response, as summarized by Emplifi. These are separate findings, not a combined estimate of the same audience.
Use selective automation for repetitive, low-risk intents. Route ambiguous policy questions, distressed customers and sensitive allegations to trained reviewers, with drafts that preserve context rather than forcing customers to repeat themselves.
Watch reviewer fatigue too. If approval queues contain repetitive low-value drafts, reviewers may skim the exceptional cases that need judgment; improve prioritization rather than demanding more approvals.
For attribution, define the comparison before changing the workflow. Report uplift only with a holdout period and a stated confidence level, and use concurrent comparison groups where practical to reduce seasonal confounding. Without that evidence, report the observed change and its limitations.
Choosing Tools and Confirming Your Next Step
Buy for the workflow you need to operate, not the dashboard that looks strongest in a demonstration. Ask vendors to process representative conversations and expose the resulting tags, routing decisions and audit history.
Use this buying checklist to test the full chain.
- Channel coverage: Verify public conversations, permitted DMs and communities across the channels customers use.
- Language and media understanding: Test slang, sarcasm, screenshots, images and mixed-language threads.
- Editable taxonomy: Require correctable auto-tagging and visible rule changes.
- Accountable routing: Check named queues, fallback owners and approval gates for public replies.
- Connected outcomes: Test CRM/data sync and identifier continuity through resolution.
- Enterprise controls: Inspect role-based permissions, audit logs and evidence of SOC 2 or ISO readiness, without confusing readiness with certification.
- Portable definitions: Require exportable metric definitions, raw event access and configurable brand voice.
Test the hard cases before committing
Sift AI is one option for this operating model: an AI operating system for social and community operations combining a unified inbox, noise filtering, auto-tagging, routing, AI-drafted replies and analytics such as noise-filtered percentage and auto-resolution. Test it against your own queues, including cases where a human must approve, decide or override the automation.
Keep paid-media execution distinct from service orchestration. If your remit also includes advertising, evaluate Meta campaign controls from NotFair as a separate campaign-control requirement rather than assuming inbox analytics covers campaign actions.
Set a practical implementation target: within 30 days, baseline a sample of 200 tagged conversations. Measure time to first human response by channel, unanswered-question rate, reopen rate and escalation precision; these are proposed pilot parameters, not industry benchmarks.
Include incorrectly filtered messages and failed handoffs in that sample. Choose two metrics, one routing rule and one named review owner, then use the baseline to decide what to expand, revise or keep under human control.
Sift AI brings cross-channel conversations, intent tagging, routing, reply drafts and operational analytics into a unified workflow, with humans responsible for the hard calls. Visit Sift AI to evaluate how your team could connect social signals to owned actions and measurable outcomes using your own support and community queues.