Performance Benchmarking for Social Ops: A Playbook
"Build a complete performance benchmarking system for social operations with practical metrics, real examples, and Sift AI capabilities"
A billing complaint starts in an X reply, spreads through Instagram DMs, and lands in a Discord channel before the support queue has a shared view of what happened. While agents duplicate screenshots and debate ownership, a TikTok mention raises a PR concern, an outage creates a second surge, and a scam wave buries legitimate feature requests. Everyone is busy, but nobody can say whether the operation is responding quickly, routing correctly, or only processing noise.
That's the hidden cost of unbenchmarked social operations. Without consistent definitions and comparable data, teams optimize isolated queues instead of the customer journey. Performance benchmarking gives social ops leaders an orchestration layer for response, routing, escalation, and continuous improvement. It doesn't replace judgment. It shows where human judgment is being wasted and where it's needed most.
Table of Contents
- Why Fragmented Social Metrics Derail Operations
- Defining Goals and Selecting the Right KPIs
- Internal Baselines versus External Comparatives
- Building Dashboards That Surface Actionable Metrics
- Ensuring Statistical Reliability in Your Benchmarks
- Reporting Cadence and Stakeholder Alignment
- Closing the Loop with Sift AI Improvement Cycles
Why Fragmented Social Metrics Derail Operations
The billing complaint looks simple from one channel. On X, an agent sees angry replies and tags them for support. On Instagram, another agent handles DMs without seeing the public conversation. In Discord, a community manager answers the same issue from a different playbook. The finance team receives a partial summary, while engineering only hears about the problem after the volume becomes impossible to ignore.
A fragmented inbox creates fragmented measurement. X may report first replies, Instagram may emphasize message handling, and Discord may be tracked through manual notes. Those numbers don't share the same clock, queue definition, or ownership rules. A fast acknowledgment on one channel can sit beside an unresolved billing problem on another, making the dashboard look healthy while customers continue repeating themselves.

The cost of measuring activity instead of control
Manual triage hides the decisions that determine service quality:
- Ownership: A billing complaint needs finance, an outage surge may need engineering and comms, and a scam wave belongs with trust and safety.
- Priority: A high-volume thread isn't automatically more urgent than a low-volume PR-risk mention.
- Context: A feature request buried in a DM may matter more than dozens of duplicate replies.
- Closure: An automated acknowledgment isn't the same as a resolved case.
When those distinctions disappear, reviewer fatigue follows. Agents spend their attention sorting duplicates, spam, sarcasm, multilingual slang, and irrelevant mentions. The difficult cases then wait beside the easy ones.
Operational rule: Benchmark the decisions your team needs to make, not the activity each platform happens to expose.
A useful framework compares like with like. Define what counts as a case, a meaningful reply, an escalation, and a closed conversation across every channel. Then track whether the system filtered noise, identified intent, routed the item to the right team, and produced an outcome within the agreed SLA.
That changes benchmarking from a reporting exercise into a control loop. A surge in billing complaints should show finance workload, response delay, duplicate suppression, and unresolved volume together. A PR-risk mention should trigger a visible escalation path rather than disappear inside a general engagement total. The point isn't to create another scorecard. It's to prevent triage chaos from becoming the operating model.
Defining Goals and Selecting the Right KPIs
A routing rule can look efficient while hiding an SLA failure. A billing case may receive an instant acknowledgment, then wait for finance to investigate. An outage mention may be tagged correctly but sit in a general queue. Set goals around these handoffs, because auto-closure rates rise only when noise is removed without burying cases that need human review.
Start by naming the decision each metric should support. Leadership may need fewer missed SLAs. Support may need less reviewer fatigue. Comms may need faster crisis escalation. Each goal requires a different measure of the route from intake to ownership, response, and closure.
First response time measures the interval from case creation to the first meaningful reply. Resolution time measures the interval from case creation to closure. Keep them separate. A quick acknowledgment does not prove that a billing issue was solved. Sift's explanation of customer support metrics makes the same distinction and defines SLA compliance as:
SLA compliance = tickets resolved within SLA ÷ total tickets × 100
Set targets only after defining the case, the clock, and the owner. Document whether the timer pauses outside business hours, how reopened conversations are counted, and which team owns a transfer. Without those rules, a dashboard can reward fast acknowledgments while unresolved work accumulates.
Track the measures that expose routing quality:
- Response speed: Compare first response time by channel, intent, language, and business hours. For queues with a few extreme delays, use percentile views alongside the average.
- Resolution performance: Keep resolution time and SLA compliance separate. Finance can own billing closure, engineering can own outage diagnosis, and comms can own risk escalation.
- Automation quality: Pair auto-closure rate with reopened cases, human overrides, and missed escalations. A higher closure rate is harmful if customers reopen conversations or reviewers correct unsafe drafts.
- Signal quality: Measure the share classified as noise, duplicate, spam, scam, or actionable intent. This shows whether reviewers are receiving judgment work or sorting clutter.
- Routing accuracy: Count misroutes and reassignment loops. A case passed from support to product and then engineering consumes more capacity than a correctly routed case, even if its final response time appears acceptable.
Use channel-specific service definitions and record exceptions for weekends, outages, and crisis queues. Before setting targets, run a 30-90 day audit plan to see how cases enter, move, reopen, and close. The audit should identify trusted metrics, queues needing normalization, and targets that would reward the wrong behavior. A structured escalation loop then gives reviewers a clear exit from repetitive triage instead of making fatigue part of the benchmark.
Internal Baselines versus External Comparatives
Internal baselines and external comparatives serve different purposes. Your internal baseline tells you whether the operation is improving under its own conditions. An external comparative shows how your service expectations relate to platform norms or industry guidance. Neither should replace the other.
Internal data is usually the better starting point. Compare X replies with earlier X replies, Instagram DMs with earlier Instagram DMs, and outage periods with comparable outage periods. Keep the business-hours calendar, staffing model, routing rules, language mix, and case definition consistent. A dashboard that compares this month's staffed-hours response with last month's 24-hour response will produce a clean-looking but useless trend.
External standards can help establish a service floor. Independent industry guidance says Facebook's “Very responsive to messages” badge requires a response time of 15 minutes or less over the past seven days, along with a 90% response rate to private messages. The same guidance recommends resolving Instagram comments or messages within the hour, with Twitter/X customer response expectations around 30 minutes. These figures come from Emplifi's contact center industry standards, and they should be treated as channel-specific reference points, not universal targets.
Normalize before you compare
A response-time comparison breaks when the underlying conditions differ. One team may cover only business hours, another may monitor continuously. One brand may receive mostly straightforward product questions, while another handles identity checks, refunds, and regulatory complaints. A global team may also face translation delays and different escalation requirements.
Use a normalization layer before placing channels or regions on the same chart:
| Comparison area | Normalize by |
|---|---|
| Response time | Business hours, time zone, queue, and first meaningful reply |
| Resolution time | Closure definition, reopen rules, and ownership |
| Volume | Actionable cases rather than raw mentions |
| SLA | Agreed window, exclusions, and escalation policy |
| Automation | Auto-closed cases, reopen rate, and human overrides |
Benchmarking guidance warns that stale data and inconsistent calculations can make comparisons unreliable, particularly across countries, business models, and reporting standards. BerryDunn's guidance on making benchmarks useful makes the practical point that naïve comparisons create apples-to-oranges errors and that one-size-fits-all targets can fail across segments or geographies.
Use external comparatives to challenge assumptions. Use internal baselines to manage the operation. If they disagree, inspect definitions and operating conditions before declaring a performance gap.
Building Dashboards That Surface Actionable Metrics
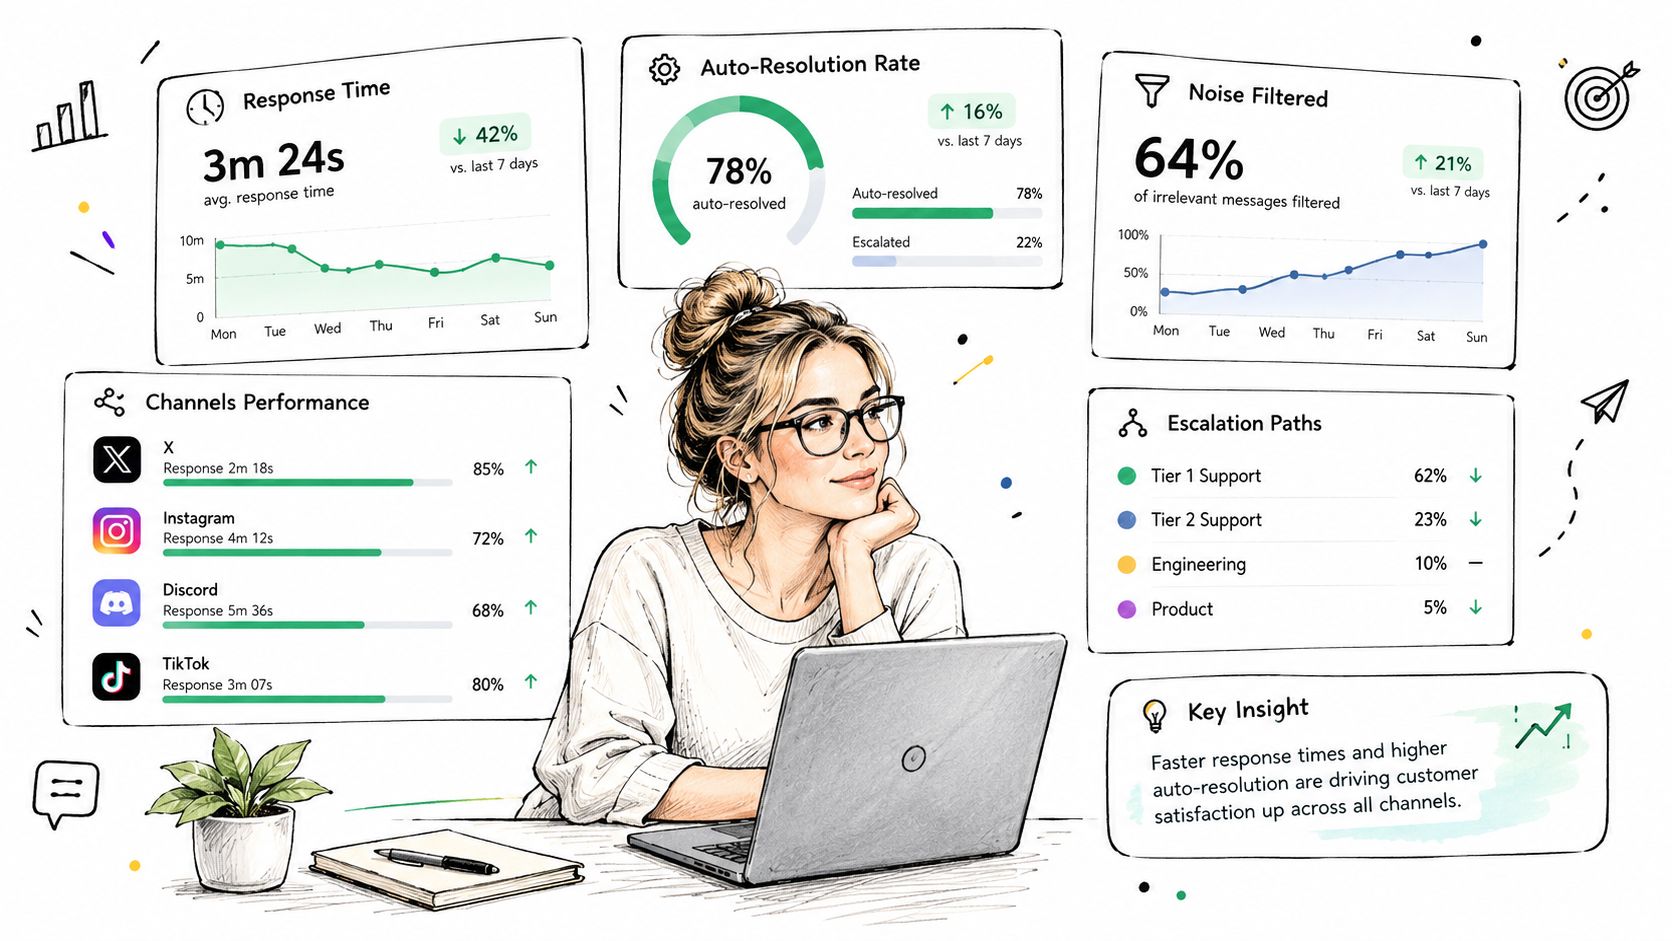
A billing complaint arrives in X replies during an outage. If the dashboard shows only rising mention volume, the team sees noise instead of a finance workload, an engineering alert, and a communications risk. An actionable dashboard makes those routing decisions visible by connecting response time, auto-resolution, noise filtering, escalation, and queue ownership.
Start with queue health, then make exceptions easy to find. Show actionable volume, first response time, resolution time, current SLA exposure, and the oldest unresolved case. Filters for channel, intent, language, region, and owner let managers isolate the queue creating pressure rather than reacting to an undifferentiated total.
A second view should explain why a metric changed:
- Noise-filtered percentage: Raw mentions can rise while actionable volume stays stable. That pattern may show that filters are removing spam, scams, duplicates, and irrelevant tags before they consume reviewer time.
- Auto-resolution rate: A higher rate is useful when reopenings and human overrides remain stable. Rising reopenings point to weak intent rules or reply drafts that need review.
- Escalation counts: More cases sent to engineering can indicate an outage. A smaller increase sent to communications can still signal greater reputational risk.
- Response distribution: Median and percentile views expose long waits that an average can hide.
Preserve the evidence behind every routing decision. For a billing complaint, retain the original message, conversation, detected intent, language, assigned owner, and escalation history. During an outage surge, show when communications and engineering alerts fired. During a spam wave, record the trust and safety route. These details make SLA reviews actionable instead of speculative.
Reviewer fatigue drops when the interface surfaces exceptions rather than every event. Agents should receive a prioritized queue with confidence, context, and a named owner, not thousands of raw mentions. Structured escalation loops also make auto-closure safer: review reopened cases, overrides, and misrouted intents, then adjust rules and drafts based on those patterns.
Teams building a broader measurement layer can use this practical guide to SaaS metrics to separate operational indicators from outcome measures. Apply the same discipline to social operations. Keep the front page limited to metrics that trigger a decision.
A dashboard earns trust when each number points to a decision, an owner, and a next action.
Ensuring Statistical Reliability in Your Benchmarks
A routing benchmark can look precise while hiding operational noise. Timer error, queue contention, network variation, and shifting workloads affect technical tests. Social queues have their own sources of distortion: routine questions sit beside outage surges, multilingual cases, and high-risk escalations. A response-time improvement measured during a quiet period may vanish when a service failure fills the queue.
Reliable comparisons start with a defined environment and representative workload. Warm up the system, run repeated trials, and report both the typical result and its spread. Use the median with the interquartile range or percentiles, then compare full distributions rather than a single run. This benchmarking methodology guide describes a repeatable measurement pipeline.
A small delta deserves inspection before it becomes a policy change. Match the channel mix, staffing coverage, intent distribution, language mix, and escalation load across trials. Otherwise, a new routing rule may appear to improve response time because fewer complex cases entered the queue.
For noisy benchmark work, expert guidance recommends at least 3 seeds, and 5 seeds for small improvements, followed by a paired t-test or Wilcoxon test. A p-value greater than 0.05 should be treated as not statistically reliable under that guidance. TheoremPath's benchmarking methodology also identifies timer error, OS jitter, and non-independent measurements as reasons small differences may reflect noise.
Apply the same checks to automation experiments:
- Hold the workload steady: Compare similar intent groups and channel conditions.
- Report the distribution: Include median, IQR, and relevant tail percentiles, not only the average.
- Inspect side effects: Track reopenings, misroutes, human overrides, and escalations.
- Repeat the trial: Use enough runs to separate a real shift from queue randomness.
For auto-closure, review reopened cases and overrides alongside closure rates. A rule that closes more tickets but increases misroutes can transfer work to reviewers and weaken SLA control. Treat the result as ready only after repeated trials, distribution checks, and an escalation review support the same conclusion.
Reporting Cadence and Stakeholder Alignment
Benchmarking loses value when teams review it only during quarterly business reviews. By then, definitions have drifted, routing rules have changed, and nobody remembers why a target moved. A disciplined cadence keeps operational decisions close to the signal while giving leadership enough time to see whether improvements hold.
Match the review to the decision
Use weekly reviews for immediate control. Support and social ops should inspect SLA adherence, oldest unresolved cases, misroutes, escalation queues, and routing failures. The question is practical: which rule, queue, or ownership handoff needs attention this week?
Use monthly reviews for system improvement. Examine auto-closure rate, noise-filtered percentage, reopenings, reviewer overrides, language-specific performance, and the distribution of response and resolution times. Product and engineering should see recurring feature requests and outage signals, while comms should review PR-risk escalations and crisis handoffs.
Use quarterly summaries for executive alignment. Connect operational movement to customer experience, risk exposure, staffing decisions, and product priorities. Leadership doesn't need a raw export of every mention. It needs a consistent explanation of what changed, why it changed, and what investment or policy decision follows.
A shared dashboard prevents each department from optimizing a different definition of success. Support shouldn't chase first response time while engineering ignores resolution ownership. Comms shouldn't suppress difficult mentions to improve sentiment while trust and safety misses a scam wave. Product shouldn't count every request equally when intent and urgency differ.
Shared-definition test: If finance, engineering, support, and comms calculate the same KPI differently, the organization doesn't have a benchmark yet. It has several opinions.
Write metric definitions into the operating process. Record the start event, end event, business-hours treatment, exclusions, reopen rules, owner, and escalation threshold. Review those definitions when workflows change, not only when a report is due. That small governance habit prevents metric drift and reduces the revision cycle that makes executives stop trusting operational reporting.
Closing the Loop with Sift AI Improvement Cycles
A benchmark becomes useful when it changes the workflow. The cycle is straightforward: measure the queue, identify the failure mode, adjust classification or routing, review human decisions, and measure the next comparable period. The aim isn't to remove people from the process. It's to reserve their time for exceptions, judgment, and accountability.
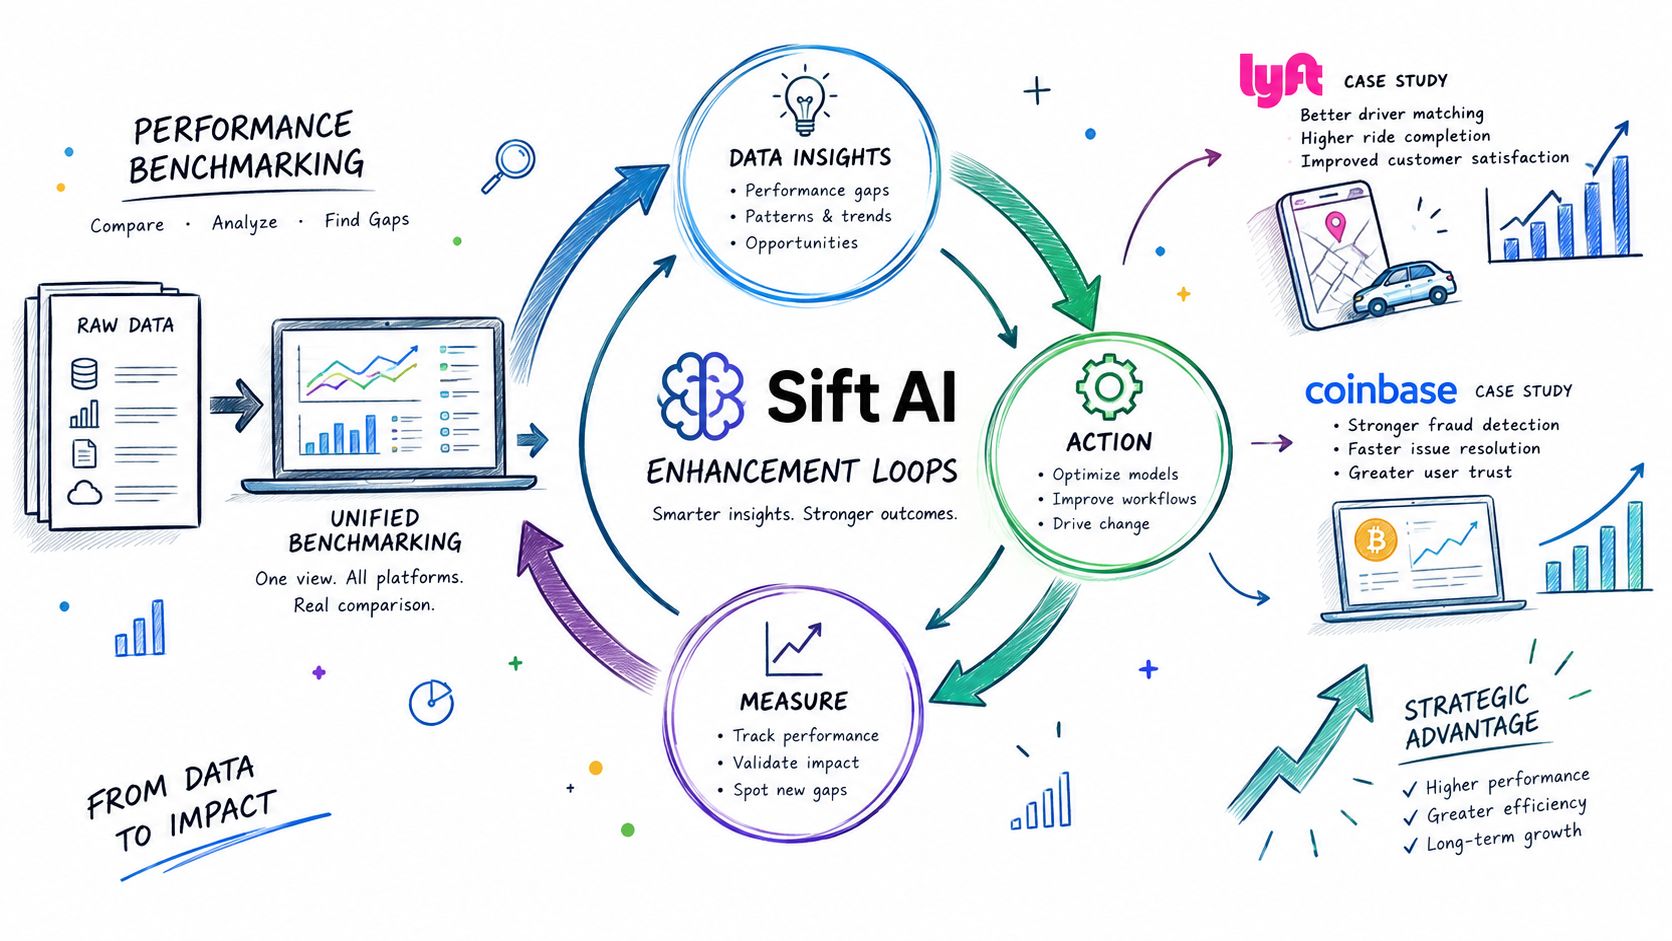
In a unified inbox, an AI system can filter spam and duplicate mentions, identify intent, route a billing issue to finance, send an outage signal to engineering and comms, and draft a response for human approval. The reviewer still decides whether the draft fits the customer's context and brand voice. That distinction matters in multilingual slang, sarcasm, crisis escalation, refund disputes, and cases where the customer's public post conflicts with CRM history.
Sift AI is one example of this operating model. It unifies social and community channels, filters noise, tags intent, routes work to teams such as support, comms, product, and trust and safety, drafts replies, and surfaces analytics for human review. Its role-based permissions and CRM or data sync can help preserve context and control while teams tune routing rules.
Turn benchmark findings into improvement sprints
Use a short sprint structure tied to your reporting cadence:
- Select one failure mode: For example, finance receives billing complaints late because replies and DMs use different tags.
- Inspect the evidence: Review misroutes, duplicate cases, response distribution, reopenings, and human overrides.
- Change one control: Adjust the intent taxonomy, routing condition, escalation threshold, or reply draft.
- Review edge cases: Have designated reviewers inspect ambiguous language, high-risk mentions, and cases that automation attempted to close.
- Compare like with like: Use the same definitions and a comparable workload before deciding whether the change worked.
- Document the decision: Record what changed, who approved it, and which benchmark will determine whether the rule remains.
For a Lyft-style support flow, the important question isn't whether the inbox contains fewer items. It's whether duplicate rider complaints are grouped, urgent account or payment issues reach the correct owner, and agents can focus on cases that need judgment. For a Coinbase-style operation, routing must distinguish routine product questions from account, fraud, or trust-sensitive issues, with permissions and escalation controls that keep high-risk decisions with the appropriate human team. These examples illustrate the workflow pattern, not a claim about specific performance results.
Put the review loop into the operating calendar. Monthly sprints can tune tags, drafts, and routing conditions. Quarterly reviews can revisit the taxonomy, ownership model, permissions, CRM context, and executive KPIs. If the auto-closure rate rises but reopened cases also rise, reduce automation scope or strengthen the human review path. If noise filtering improves but a PR-risk mention is missed, prioritize recall and escalation visibility over volume reduction.
The history of benchmarking supports this discipline. Modern performance benchmarking moved from earlier industrial measurement practices into a formal management discipline, with Xerox coining “competitive benchmarking” in 1979, Robert Camp's book spreading the method in 1989, and the Global Benchmarking Network forming in 1994. In computing, LINPACK appeared in 1979, and the TOP500 ranking launched in 1993, showing how shared definitions and repeatable conditions turn scattered measurements into a usable yardstick. This history of performance benchmarking provides the broader context.
The same logic applies to social operations. A score alone won't fix triage. A controlled loop that connects signal quality, routing, human review, and outcome measurement can.
Give leadership one shared view of social demand and operational control with Sift AI, including unified inbox workflows, intent-based routing, noise filtering, AI-drafted replies, and analytics for response, escalation, and auto-closure. Start by benchmarking one high-friction queue, then use the results to design your next improvement sprint.